4321 Fran Way El Sobrante, CA 94803
May Valley NeighborhoodEstimated Value: $701,167 - $762,000
3
Beds
2
Baths
1,460
Sq Ft
$500/Sq Ft
Est. Value
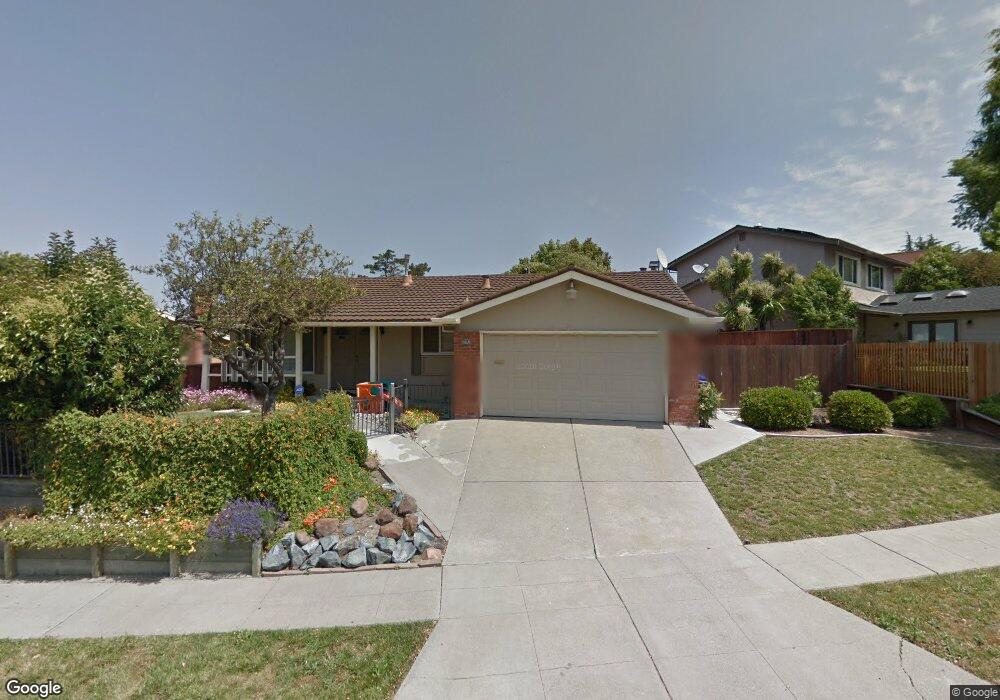
About This Home
This home is located at 4321 Fran Way, El Sobrante, CA 94803 and is currently estimated at $729,542, approximately $499 per square foot. 4321 Fran Way is a home located in Contra Costa County with nearby schools including Murphy Elementary School, Betty Reid Soskin Middle School, and De Anza Senior High School.
Ownership History
Date
Name
Owned For
Owner Type
Purchase Details
Closed on
Mar 29, 2011
Sold by
Federal National Mortgage Association
Bought by
Mohamadmoradi Alireza and Yazdanpanah Somayeh
Current Estimated Value
Home Financials for this Owner
Home Financials are based on the most recent Mortgage that was taken out on this home.
Original Mortgage
$259,256
Outstanding Balance
$179,697
Interest Rate
4.9%
Mortgage Type
FHA
Estimated Equity
$549,845
Purchase Details
Closed on
Nov 15, 2010
Sold by
Lunak Janet
Bought by
Fannie Mae
Purchase Details
Closed on
Apr 28, 2008
Sold by
Bly Phyllis J
Bought by
Lunak Janet
Home Financials for this Owner
Home Financials are based on the most recent Mortgage that was taken out on this home.
Original Mortgage
$260,000
Interest Rate
5.81%
Mortgage Type
Purchase Money Mortgage
Purchase Details
Closed on
May 3, 2006
Sold by
Bly Robert W and Bly Phyllis J
Bought by
Bly Robert W and Bly Phyllis J
Create a Home Valuation Report for This Property
The Home Valuation Report is an in-depth analysis detailing your home's value as well as a comparison with similar homes in the area
Home Values in the Area
Average Home Value in this Area
Purchase History
| Date | Buyer | Sale Price | Title Company |
|---|---|---|---|
| Mohamadmoradi Alireza | $266,000 | Lawyers Title Insurance Corp | |
| Fannie Mae | $282,974 | None Available | |
| Lunak Janet | $405,000 | North American Title Company | |
| Bly Robert W | -- | None Available |
Source: Public Records
Mortgage History
| Date | Status | Borrower | Loan Amount |
|---|---|---|---|
| Open | Mohamadmoradi Alireza | $259,256 | |
| Previous Owner | Lunak Janet | $260,000 |
Source: Public Records
Tax History Compared to Growth
Tax History
| Year | Tax Paid | Tax Assessment Tax Assessment Total Assessment is a certain percentage of the fair market value that is determined by local assessors to be the total taxable value of land and additions on the property. | Land | Improvement |
|---|---|---|---|---|
| 2025 | $5,708 | $331,811 | $192,170 | $139,641 |
| 2024 | $5,579 | $325,305 | $188,402 | $136,903 |
| 2023 | $5,579 | $318,927 | $184,708 | $134,219 |
| 2022 | $5,489 | $312,675 | $181,087 | $131,588 |
| 2021 | $5,446 | $306,545 | $177,537 | $129,008 |
| 2019 | $5,158 | $297,455 | $172,272 | $125,183 |
| 2018 | $4,958 | $291,624 | $168,895 | $122,729 |
| 2017 | $4,828 | $285,907 | $165,584 | $120,323 |
| 2016 | $4,746 | $280,302 | $162,338 | $117,964 |
| 2015 | $4,710 | $276,093 | $159,900 | $116,193 |
| 2014 | $4,662 | $270,685 | $156,768 | $113,917 |
Source: Public Records
Map
Nearby Homes
- 3115 Deseret Dr
- 4428 Santa Rita Rd
- 4503 Gregory Way
- 2835 Stephen Dr
- 3179 Keith Dr
- 371 Joan Vista St
- 4520 Valley View Rd
- 107 Alice Ln Unit 13
- 1923 Thompson Ln
- 4623 Appian Way
- 663 Renfrew Rd
- 435 Colina Way
- 535 Rincon Rd
- 4556 Appian Way Unit 36
- 4556 Appian Way Unit 12
- 636 Pebble Dr
- 476 Colina Way
- 5024 Escalon Cir
- 3415 May Rd
- 4778 Hilltop Dr Unit 1