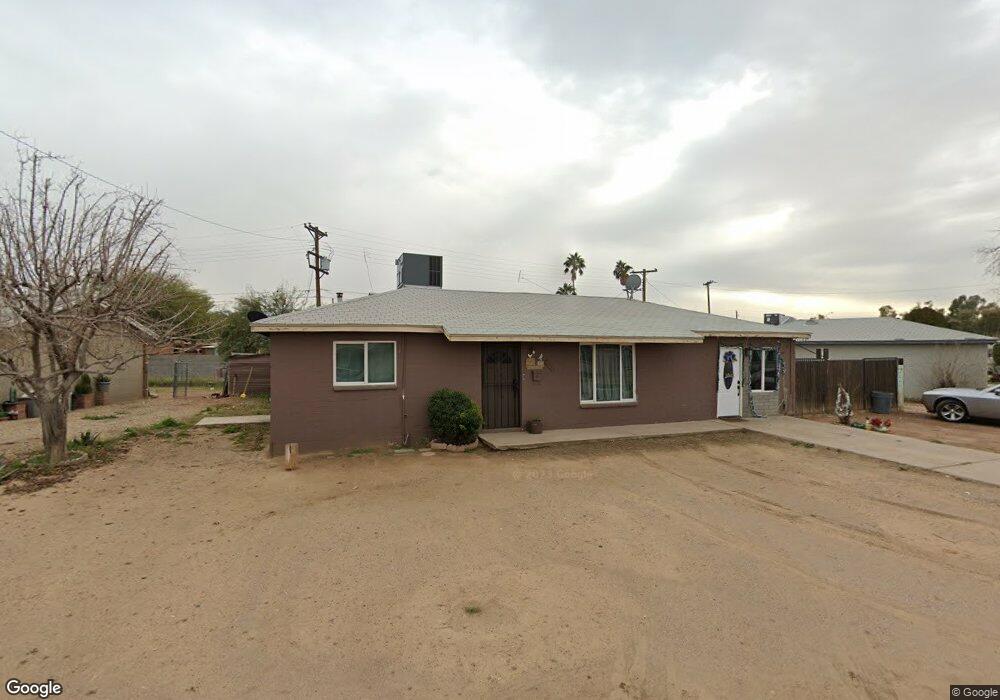
4321 N 58th Dr Phoenix, AZ 85031
Estimated Value: $276,565 - $362,000
--
Bed
2
Baths
1,618
Sq Ft
$199/Sq Ft
Est. Value
About This Home
This home is located at 4321 N 58th Dr, Phoenix, AZ 85031 and is currently estimated at $322,641, approximately $199 per square foot. 4321 N 58th Dr is a home located in Maricopa County with nearby schools including Marc T. Atkinson Middle School, Maryvale High School, and Phoenix Coding Academy.
Ownership History
Date
Name
Owned For
Owner Type
Purchase Details
Closed on
May 15, 2020
Sold by
Betanzos Jose A
Bought by
Medina Arlyn Del Carmen Betanzos
Current Estimated Value
Home Financials for this Owner
Home Financials are based on the most recent Mortgage that was taken out on this home.
Original Mortgage
$114,000
Outstanding Balance
$100,829
Interest Rate
3.2%
Mortgage Type
New Conventional
Estimated Equity
$221,812
Purchase Details
Closed on
Nov 18, 1997
Sold by
Hud
Bought by
Betanzos Jose A
Home Financials for this Owner
Home Financials are based on the most recent Mortgage that was taken out on this home.
Original Mortgage
$64,050
Interest Rate
7.02%
Mortgage Type
FHA
Purchase Details
Closed on
May 21, 1997
Sold by
Woodard William
Bought by
Weyerhaeuser Mtg Company
Purchase Details
Closed on
May 20, 1997
Sold by
Weyerhaeuser Mtg Company
Bought by
Hud
Create a Home Valuation Report for This Property
The Home Valuation Report is an in-depth analysis detailing your home's value as well as a comparison with similar homes in the area
Home Values in the Area
Average Home Value in this Area
Purchase History
| Date | Buyer | Sale Price | Title Company |
|---|---|---|---|
| Medina Arlyn Del Carmen Betanzos | $190,000 | Driggs Title Agency Inc | |
| Betanzos Jose A | -- | First Southwestern Title | |
| Weyerhaeuser Mtg Company | -- | Chicago Title Insurance Co | |
| Hud | -- | Chicago Title Insurance Co |
Source: Public Records
Mortgage History
| Date | Status | Borrower | Loan Amount |
|---|---|---|---|
| Open | Medina Arlyn Del Carmen Betanzos | $114,000 | |
| Previous Owner | Betanzos Jose A | $64,050 | |
| Closed | Betanzos Jose A | $1,500 |
Source: Public Records
Tax History Compared to Growth
Tax History
| Year | Tax Paid | Tax Assessment Tax Assessment Total Assessment is a certain percentage of the fair market value that is determined by local assessors to be the total taxable value of land and additions on the property. | Land | Improvement |
|---|---|---|---|---|
| 2025 | $1,800 | $11,607 | -- | -- |
| 2024 | $1,846 | $11,055 | -- | -- |
| 2023 | $1,846 | $23,100 | $4,620 | $18,480 |
| 2022 | $1,733 | $17,360 | $3,470 | $13,890 |
| 2021 | $1,769 | $15,350 | $3,070 | $12,280 |
| 2020 | $1,670 | $14,050 | $2,810 | $11,240 |
| 2019 | $1,594 | $12,030 | $2,400 | $9,630 |
| 2018 | $773 | $10,350 | $2,070 | $8,280 |
| 2017 | $737 | $8,420 | $1,680 | $6,740 |
| 2016 | $704 | $7,130 | $1,420 | $5,710 |
| 2015 | $649 | $6,220 | $1,240 | $4,980 |
Source: Public Records
Map
Nearby Homes
- 4202 N 58th Ave
- 5811 W Campbell Ave
- 5839 W Rosewood Ln
- 5602 W Heatherbrae Dr
- 4411 N 56th Dr
- 0 N 56th Dr Unit 2381
- 5716 W Hazelwood St
- 4403 N 56th Dr
- 5525 W Glenrosa Ave
- 5616 W Indian School Rd
- 4635 N 58th Dr
- 5915 W Hazelwood St
- 4041 N 56th Ave
- 6010 W Coolidge St
- 5968 W Coolidge St
- 4729 N 58th Dr
- 4734 N 61st Ave
- 6275 W Wolf St
- 5520 W Clarendon Ave
- 3633 N 60th Ave
- 4325 N 58th Dr
- 4311 N 58th Dr
- 5808 W Glenrosa Ave
- 5802 W Glenrosa Ave
- 4322 N 58th Dr
- 4329 N 58th Dr
- 4318 N 58th Dr
- 4301 N 58th Dr
- 4328 N 58th Dr
- 5740 W Glenrosa Ave
- 4314 N 58th Dr
- 4310 N 58th Dr
- 4332 N 58th Dr
- 4333 N 58th Dr
- 5736 W Glenrosa Ave
- 5733 W Turney Ave
- 4306 N 58th Dr
- 5732 W Turney Ave
- 5809 W Glenrosa Ave
- 5827 W Montecito Ave