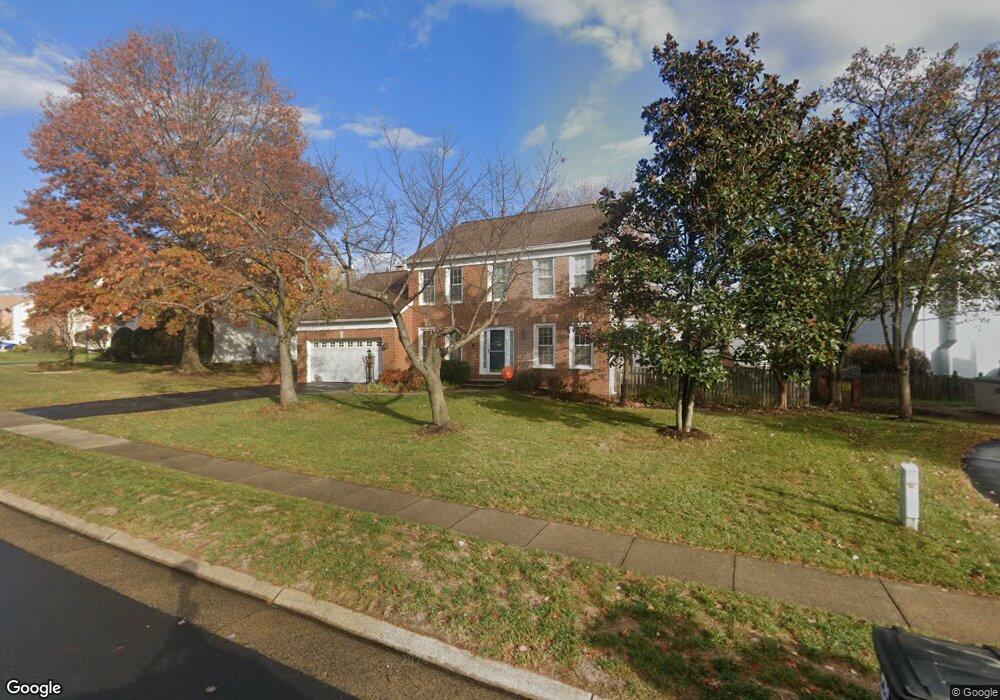
43212 Wayside Cir Ashburn, VA 20147
Estimated Value: $881,250 - $935,000
4
Beds
4
Baths
2,316
Sq Ft
$389/Sq Ft
Est. Value
About This Home
This home is located at 43212 Wayside Cir, Ashburn, VA 20147 and is currently estimated at $900,063, approximately $388 per square foot. 43212 Wayside Cir is a home located in Loudoun County with nearby schools including Sanders Corner Elementary School, Trailside Middle School, and Stone Bridge High.
Ownership History
Date
Name
Owned For
Owner Type
Purchase Details
Closed on
Dec 14, 2018
Sold by
Sapsara Michael D and Sapsara Arlene V
Bought by
Sapsara Michael Dennis and Sapsara Arlene Vera
Current Estimated Value
Purchase Details
Closed on
May 3, 1999
Sold by
Castellitto Eugene J
Bought by
Sapsara Michael D
Home Financials for this Owner
Home Financials are based on the most recent Mortgage that was taken out on this home.
Original Mortgage
$219,900
Interest Rate
6.99%
Purchase Details
Closed on
Feb 2, 1998
Sold by
Young Cary S and Young Carolyn A
Bought by
Castellitto Eugene J and Castellitto Katharine A
Home Financials for this Owner
Home Financials are based on the most recent Mortgage that was taken out on this home.
Original Mortgage
$182,500
Interest Rate
7.02%
Mortgage Type
New Conventional
Create a Home Valuation Report for This Property
The Home Valuation Report is an in-depth analysis detailing your home's value as well as a comparison with similar homes in the area
Home Values in the Area
Average Home Value in this Area
Purchase History
| Date | Buyer | Sale Price | Title Company |
|---|---|---|---|
| Sapsara Michael Dennis | -- | None Available | |
| Sapsara Michael D | $219,900 | -- | |
| Castellitto Eugene J | $232,500 | -- |
Source: Public Records
Mortgage History
| Date | Status | Borrower | Loan Amount |
|---|---|---|---|
| Previous Owner | Sapsara Michael D | $219,900 | |
| Previous Owner | Castellitto Eugene J | $182,500 |
Source: Public Records
Tax History
| Year | Tax Paid | Tax Assessment Tax Assessment Total Assessment is a certain percentage of the fair market value that is determined by local assessors to be the total taxable value of land and additions on the property. | Land | Improvement |
|---|---|---|---|---|
| 2025 | $6,799 | $844,540 | $299,400 | $545,140 |
| 2024 | $7,026 | $812,300 | $299,800 | $512,500 |
| 2023 | $6,901 | $788,650 | $299,800 | $488,850 |
| 2022 | $6,615 | $743,220 | $269,800 | $473,420 |
| 2021 | $6,440 | $657,190 | $219,800 | $437,390 |
| 2020 | $6,384 | $616,820 | $199,400 | $417,420 |
| 2019 | $6,292 | $602,130 | $199,400 | $402,730 |
| 2018 | $6,105 | $562,650 | $179,400 | $383,250 |
| 2017 | $6,144 | $546,150 | $179,400 | $366,750 |
| 2016 | $6,159 | $537,870 | $0 | $0 |
| 2015 | $6,138 | $361,420 | $0 | $361,420 |
| 2014 | $5,897 | $331,130 | $0 | $331,130 |
Source: Public Records
Map
Nearby Homes
- 43494 Postrail Square
- 20504 Deerwatch Place
- 20525 Lansing Terrace
- 43147 Gatwick Square
- 43105 Gatwick Square
- 43245 Stillforest Terrace
- 21014 Timber Ridge Terrace Unit 302
- 43374 Greyswallow Terrace
- 21018 Strawrick Terrace
- 43312 Greyswallow Terrace
- 20385 Belmont Park Terrace Unit 103
- 20857 Ashburn Rd
- 20385 Medalist Dr
- 20432 Homeland Terrace
- 20413 Peckham St
- 43334 Butterfield Ct
- 20483 Hazleton Way
- 43834 Jenkins Ln
- 20258 Kentucky Oaks Ct
- 21027 Forest Highlands Ct
- 43208 Wayside Cir
- 20741 Edgebrook Ct
- 43216 Wayside Cir
- 20737 Edgebrook Ct
- 43204 Wayside Cir
- 20733 Edgebrook Ct
- 43209 Wayside Cir
- 43217 Wayside Cir
- 43205 Wayside Cir
- 20729 Edgebrook Ct
- 43221 Wayside Cir
- 20748 Edgebrook Ct
- 43200 Wayside Cir
- 20744 Edgebrook Ct
- 20768 Dewberry Ct
- 43201 Wayside Cir
- 43224 Wayside Cir
- 20740 Edgebrook Ct
- 20725 Edgebrook Ct
- 20736 Edgebrook Ct
Your Personal Tour Guide
Ask me questions while you tour the home.