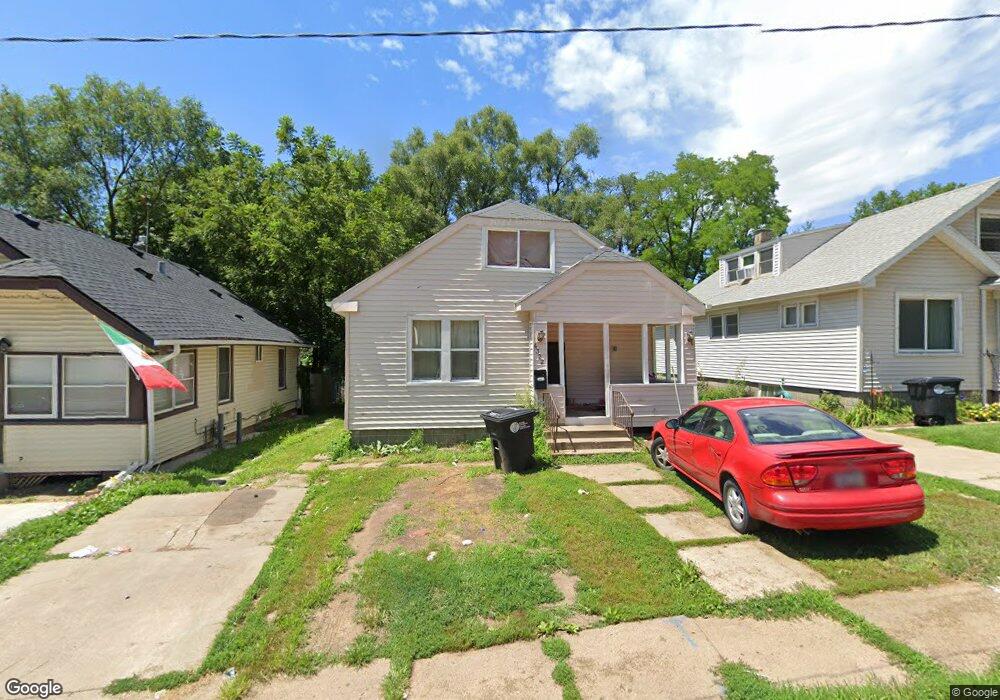
4322 N 39th St Omaha, NE 68111
Northwest Community Club NeighborhoodEstimated Value: $121,550 - $169,000
3
Beds
1
Bath
1,142
Sq Ft
$128/Sq Ft
Est. Value
About This Home
This home is located at 4322 N 39th St, Omaha, NE 68111 and is currently estimated at $145,888, approximately $127 per square foot. 4322 N 39th St is a home located in Douglas County with nearby schools including Skinner Elementary School, McMillan Middle School, and North High School.
Ownership History
Date
Name
Owned For
Owner Type
Purchase Details
Closed on
Sep 1, 2018
Sold by
Painter Jeffrey S and Painter Melissa K
Bought by
Kreikemeier Properties Inc
Current Estimated Value
Purchase Details
Closed on
Dec 20, 2017
Sold by
Kreikemeier Properties Inc
Bought by
Council Bluffs Development Corporation L
Home Financials for this Owner
Home Financials are based on the most recent Mortgage that was taken out on this home.
Original Mortgage
$32,000
Interest Rate
4.8%
Mortgage Type
New Conventional
Purchase Details
Closed on
Oct 28, 2009
Sold by
Kfs Enterprises Llc
Bought by
Painter Jeffrey S and Painter Melissa K
Home Financials for this Owner
Home Financials are based on the most recent Mortgage that was taken out on this home.
Original Mortgage
$54,950
Interest Rate
5.05%
Mortgage Type
New Conventional
Purchase Details
Closed on
Jul 14, 2003
Sold by
Brown Lamar
Bought by
Carter Lynn
Purchase Details
Closed on
Sep 26, 2001
Sold by
Ammons Linda
Bought by
Brown Lamar D
Create a Home Valuation Report for This Property
The Home Valuation Report is an in-depth analysis detailing your home's value as well as a comparison with similar homes in the area
Home Values in the Area
Average Home Value in this Area
Purchase History
| Date | Buyer | Sale Price | Title Company |
|---|---|---|---|
| Kreikemeier Properties Inc | -- | None Available | |
| Council Bluffs Development Corporation L | $32,000 | None Available | |
| Painter Jeffrey S | $61,000 | None Available | |
| Carter Lynn | $17,000 | -- | |
| Brown Lamar D | $17,000 | -- |
Source: Public Records
Mortgage History
| Date | Status | Borrower | Loan Amount |
|---|---|---|---|
| Previous Owner | Council Bluffs Development Corporation L | $32,000 | |
| Previous Owner | Painter Jeffrey S | $54,950 |
Source: Public Records
Tax History Compared to Growth
Tax History
| Year | Tax Paid | Tax Assessment Tax Assessment Total Assessment is a certain percentage of the fair market value that is determined by local assessors to be the total taxable value of land and additions on the property. | Land | Improvement |
|---|---|---|---|---|
| 2024 | $1,483 | $82,700 | $8,300 | $74,400 |
| 2023 | $1,483 | $70,300 | $8,300 | $62,000 |
| 2022 | $1,432 | $67,100 | $5,100 | $62,000 |
| 2021 | $1,266 | $59,800 | $5,100 | $54,700 |
| 2020 | $863 | $40,300 | $5,100 | $35,200 |
| 2019 | $801 | $37,300 | $700 | $36,600 |
| 2018 | $802 | $37,300 | $700 | $36,600 |
| 2017 | $582 | $30,100 | $700 | $29,400 |
| 2016 | $582 | $27,100 | $600 | $26,500 |
| 2015 | $1,232 | $58,200 | $4,300 | $53,900 |
| 2014 | $1,232 | $58,200 | $4,300 | $53,900 |
Source: Public Records
Map
Nearby Homes
- 4316 N 38th St
- 4320 N 38th St
- 4419 N 39th St
- 4301 N 40th St
- 4224 N 37th St
- 4138 N 37th St
- 4515 N 39th St
- 4328 N 40th Ave
- 3674 Ames Ave
- 3944 N 38th St
- 4524 N 38th St
- 4510 N 40th St
- 3672 Ames Ave
- 4055 Paxton Blvd
- 3666 Ames Ave
- 4331 N 41st St
- 4345 N 41st St
- 3956 N 40th Ave
- 3916 N 39th St
- 3721 Fowler Ave