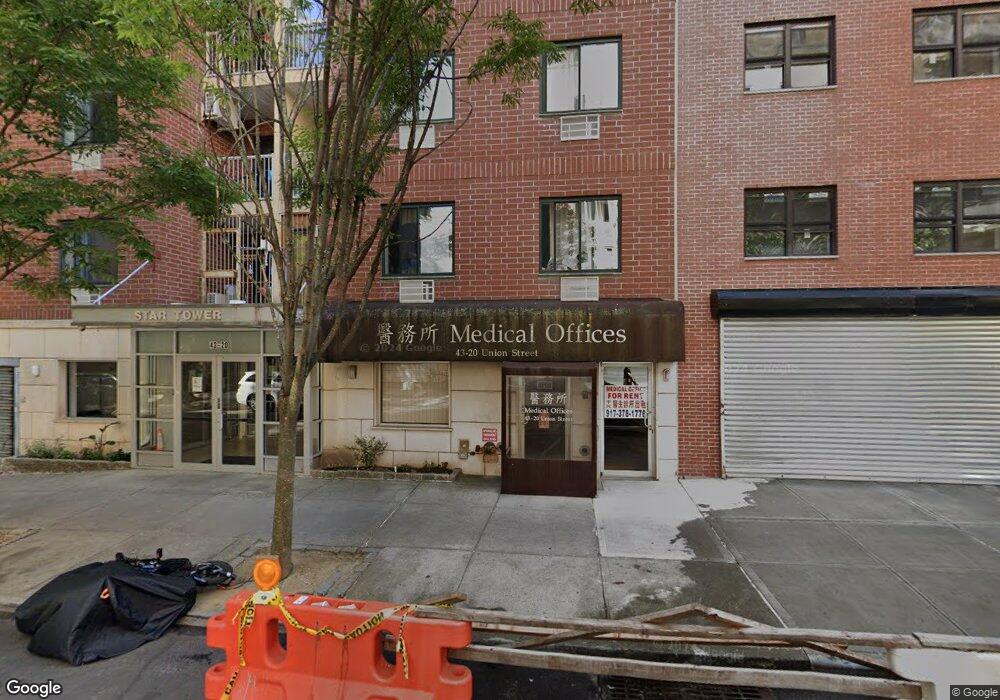
4322 Union St Unit 6D Flushing, NY 11355
Flushing NeighborhoodEstimated Value: $550,000 - $654,000
--
Bed
--
Bath
600
Sq Ft
$986/Sq Ft
Est. Value
About This Home
This home is located at 4322 Union St Unit 6D, Flushing, NY 11355 and is currently estimated at $591,409, approximately $985 per square foot. 4322 Union St Unit 6D is a home located in Queens County with nearby schools including P.S. 024 Andrew Jackson School, Rachel Carson I.S. 237Q, and John Bowne High School.
Ownership History
Date
Name
Owned For
Owner Type
Purchase Details
Closed on
Jun 30, 2017
Sold by
Ding Julia Hong
Bought by
Chiang Tzu Lin
Current Estimated Value
Home Financials for this Owner
Home Financials are based on the most recent Mortgage that was taken out on this home.
Original Mortgage
$437,600
Outstanding Balance
$364,170
Interest Rate
3.95%
Mortgage Type
New Conventional
Estimated Equity
$227,239
Purchase Details
Closed on
Dec 6, 2016
Sold by
Ding Julia H and Li Jing
Bought by
Ding Julia H
Purchase Details
Closed on
Mar 25, 2016
Sold by
Craig D Zim Esq As Referee
Bought by
Ding Julia H and Li Jing
Purchase Details
Closed on
Dec 27, 2007
Sold by
Ocean Star Development Llc
Bought by
Chan Wei Teh and Chow Evonne
Home Financials for this Owner
Home Financials are based on the most recent Mortgage that was taken out on this home.
Original Mortgage
$337,250
Interest Rate
6.21%
Create a Home Valuation Report for This Property
The Home Valuation Report is an in-depth analysis detailing your home's value as well as a comparison with similar homes in the area
Home Values in the Area
Average Home Value in this Area
Purchase History
| Date | Buyer | Sale Price | Title Company |
|---|---|---|---|
| Chiang Tzu Lin | $547,000 | -- | |
| Ding Julia H | $250,000 | -- | |
| Ding Julia H | $395,460 | -- | |
| Chan Wei Teh | $355,000 | -- | |
| Chan Wei Teh | $355,000 | -- |
Source: Public Records
Mortgage History
| Date | Status | Borrower | Loan Amount |
|---|---|---|---|
| Open | Chiang Tzu Lin | $437,600 | |
| Previous Owner | Chan Wei Teh | $337,250 |
Source: Public Records
Tax History Compared to Growth
Tax History
| Year | Tax Paid | Tax Assessment Tax Assessment Total Assessment is a certain percentage of the fair market value that is determined by local assessors to be the total taxable value of land and additions on the property. | Land | Improvement |
|---|---|---|---|---|
| 2025 | $8,507 | $70,447 | $6,102 | $64,345 |
| 2024 | $8,507 | $68,045 | $6,102 | $61,943 |
| 2023 | $8,894 | $71,140 | $6,102 | $65,038 |
| 2022 | $7,092 | $72,148 | $6,102 | $66,046 |
| 2021 | $4,921 | $65,959 | $6,102 | $59,857 |
| 2020 | $3,546 | $75,869 | $6,102 | $69,767 |
| 2019 | $1,777 | $74,009 | $6,102 | $67,907 |
| 2018 | $171 | $60,655 | $6,103 | $54,552 |
| 2017 | $171 | $58,854 | $6,102 | $52,752 |
| 2016 | $174 | $58,854 | $6,102 | $52,752 |
| 2015 | $136 | $57,413 | $6,102 | $51,311 |
| 2014 | $136 | $57,484 | $6,103 | $51,381 |
Source: Public Records
Map
Nearby Homes
- 43-20 Union St Unit 6D
- 4317 Union St Unit 4E
- 4317 Union St Unit 2B
- 43-17 Union St Unit 6C
- 4317 Union St Unit 5A
- 43-17 Union St Unit 6G
- 4317 Union St Unit 2E
- 140-26 Cherry Ave Unit 5D
- 14026 Cherry Ave Unit 5C
- 140-20 Cherry Ave Unit 3B
- 140-20 Cherry Ave Unit 3A
- 31-16 Union St
- 43-36 Robinson St Unit 4F
- 43-36 Robinson St Unit 5L
- 43-18 Robinson St Unit 7C
- 43-18 Robinson St Unit 2
- 43-18 Robinson St Unit 7D
- 140-22 Beech Ave Unit 7E
- 140-22 Beech Ave Unit 8F
- 141-18 Cherry Ave Unit Pc10
- 4322 Union St
- 4322 Union St Unit 7D
- 4322 Union St Unit 7C
- 4322 Union St Unit 7B
- 4322 Union St Unit 7A
- 4322 Union St Unit 6C
- 4322 Union St Unit 6B
- 4322 Union St Unit 6A
- 4322 Union St Unit 5D
- 4322 Union St Unit 5C
- 4322 Union St Unit 5B
- 4322 Union St Unit 5A
- 4322 Union St Unit 4D
- 4322 Union St Unit 4C
- 4322 Union St Unit 4B
- 4322 Union St Unit 2B
- 4322 Union St Unit 3D
- 4322 Union St Unit 3C
- 4322 Union St Unit 3B
- 4322 Union St Unit 3A