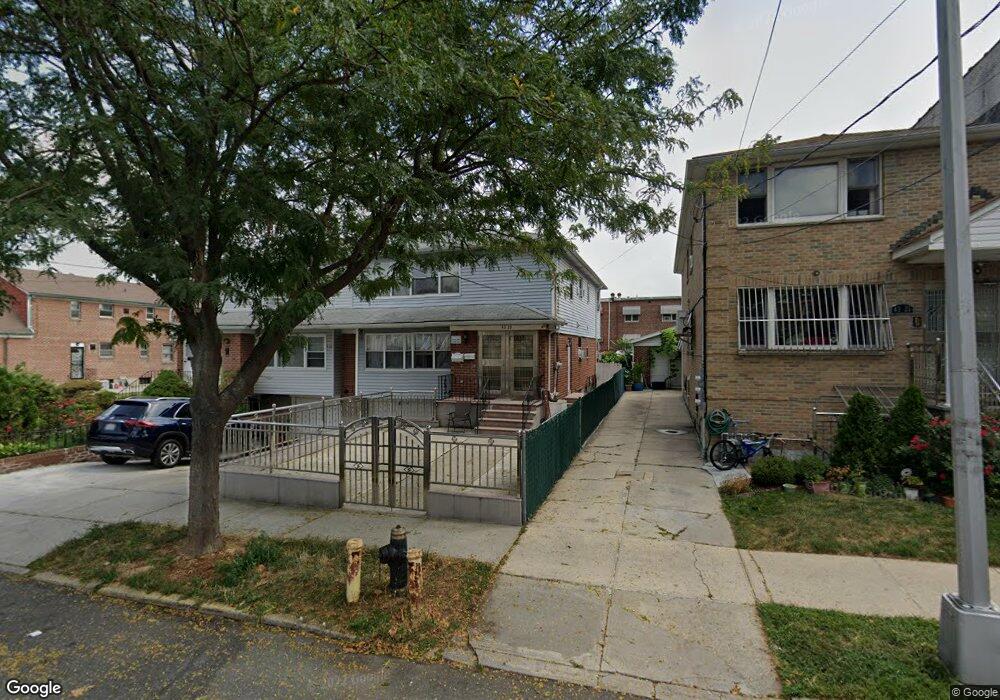
4323 157th St Flushing, NY 11355
East Flushing NeighborhoodEstimated Value: $1,402,000 - $1,738,000
Studio
--
Bath
2,600
Sq Ft
$599/Sq Ft
Est. Value
About This Home
This home is located at 4323 157th St, Flushing, NY 11355 and is currently estimated at $1,556,563, approximately $598 per square foot. 4323 157th St is a home located in Queens County with nearby schools including P.S. 22 - Thomas Jefferson, J.H.S. 189Q Daniel Carter Beard, and Francis Lewis High School.
Ownership History
Date
Name
Owned For
Owner Type
Purchase Details
Closed on
May 27, 2025
Sold by
Chen Bilin and Lin Xin
Bought by
Lin Xin
Current Estimated Value
Purchase Details
Closed on
Jul 31, 2017
Sold by
Estate Of Joseph Cacciola and Hay
Bought by
Chen Bilin and Lin Xin
Home Financials for this Owner
Home Financials are based on the most recent Mortgage that was taken out on this home.
Original Mortgage
$499,500
Outstanding Balance
$413,877
Interest Rate
3.88%
Mortgage Type
New Conventional
Estimated Equity
$1,142,686
Purchase Details
Closed on
May 24, 2012
Sold by
Estate Of Frank Caciola and Joseph Cacciola As
Bought by
Cacciola Joseph and Hay Maria
Purchase Details
Closed on
Jun 16, 2008
Sold by
Boxer Co-Administratrix Harriet and Boxer Boxer
Bought by
Jgnyc Properties Llc
Create a Home Valuation Report for This Property
The Home Valuation Report is an in-depth analysis detailing your home's value as well as a comparison with similar homes in the area
Home Values in the Area
Average Home Value in this Area
Purchase History
| Date | Buyer | Sale Price | Title Company |
|---|---|---|---|
| Lin Xin | -- | -- | |
| Lin Xin | -- | -- | |
| Chen Bilin | $975,000 | -- | |
| Chen Bilin | $975,000 | -- | |
| Cacciola Joseph | -- | -- | |
| Cacciola Joseph | -- | -- | |
| Jgnyc Properties Llc | $350,000 | -- | |
| Jgnyc Properties Llc | $350,000 | -- |
Source: Public Records
Mortgage History
| Date | Status | Borrower | Loan Amount |
|---|---|---|---|
| Open | Chen Bilin | $499,500 | |
| Closed | Chen Bilin | $499,500 |
Source: Public Records
Tax History
| Year | Tax Paid | Tax Assessment Tax Assessment Total Assessment is a certain percentage of the fair market value that is determined by local assessors to be the total taxable value of land and additions on the property. | Land | Improvement |
|---|---|---|---|---|
| 2025 | $11,195 | $59,081 | $14,875 | $44,206 |
| 2024 | $11,195 | $55,738 | $16,173 | $39,565 |
| 2023 | $11,195 | $55,738 | $14,069 | $41,669 |
| 2022 | $11,043 | $89,040 | $23,520 | $65,520 |
| 2021 | $10,983 | $84,120 | $23,520 | $60,600 |
| 2020 | $10,421 | $82,560 | $23,520 | $59,040 |
| 2019 | $9,716 | $80,760 | $23,520 | $57,240 |
| 2018 | $9,468 | $46,448 | $15,173 | $31,275 |
| 2017 | $9,308 | $46,098 | $18,402 | $27,696 |
| 2016 | $8,034 | $46,098 | $18,402 | $27,696 |
| 2015 | $4,820 | $41,028 | $16,885 | $24,143 |
| 2014 | $4,820 | $38,707 | $19,112 | $19,595 |
Source: Public Records
Map
Nearby Homes
- 43-23 156th St
- 4304 158th St Unit L4
- 4304 158th St Unit 2C
- 43-04 158th St Unit 3E
- 45-19 158th St
- 42-36 156th St
- 42-20 158th St
- 42-28 159th St
- 149-27 45th Ave
- 4363 160th St
- 154-21 Ash Ave
- 4344 161st St
- 4307 149th St
- 149-63 Ash Ave
- 149-36 Ash Ave
- 155-17 Sanford Ave Unit E
- 155-17 Sanford Ave Unit 6D
- 155-17 Sanford Ave Unit 6A
- 155-17 Sanford Ave Unit 2F
- 45-57 160th St
- 4321 157th St
- 4325 157th St
- 43-25 157th St
- 43-25 157th St Unit 2
- 4325 157th St
- 157 Street
- 4329 157th St
- 43-29 157th St Unit 2
- 43-29 157th St
- 43-23 157th St Unit 2 Fl
- 43-21 157th St
- 4331 157th St
- 4311 157th St
- 4322 158th St
- 4324 158th St
- 4320 158th St
- 4328 158th St
- 43-28 158th St
- 43-28 158th St Unit 1FL
- 43-28 158th St Unit 2FL
Your Personal Tour Guide
Ask me questions while you tour the home.