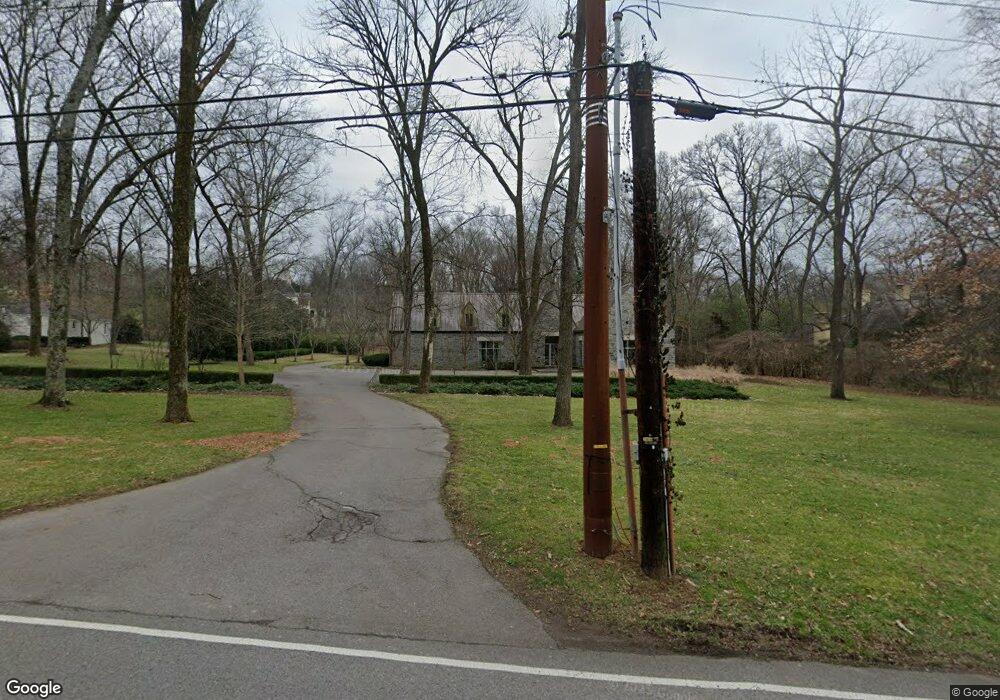
4323 Glen Eden Dr Nashville, TN 37205
Belle Meade NeighborhoodEstimated Value: $4,852,049 - $5,609,000
4
Beds
4
Baths
7,045
Sq Ft
$756/Sq Ft
Est. Value
About This Home
This home is located at 4323 Glen Eden Dr, Nashville, TN 37205 and is currently estimated at $5,326,683, approximately $756 per square foot. 4323 Glen Eden Dr is a home located in Davidson County with nearby schools including Julia Green Elementary School, John Trotwood Moore Middle School, and Hillsboro High School.
Ownership History
Date
Name
Owned For
Owner Type
Purchase Details
Closed on
Sep 29, 2016
Sold by
Greenberg Elliot G and Greenberg Alizah
Bought by
Greenberg Elliot S and Greenberg Alizah
Current Estimated Value
Purchase Details
Closed on
Oct 28, 2005
Sold by
Mcneilly Robert E
Bought by
Greenberg Elliott G and Greenberg Alizah
Home Financials for this Owner
Home Financials are based on the most recent Mortgage that was taken out on this home.
Original Mortgage
$800,000
Interest Rate
4.75%
Purchase Details
Closed on
Feb 7, 2005
Sold by
Mcneilly Robert E
Bought by
Mcneilly Robert E
Home Financials for this Owner
Home Financials are based on the most recent Mortgage that was taken out on this home.
Original Mortgage
$449,002
Interest Rate
5.69%
Mortgage Type
Seller Take Back
Purchase Details
Closed on
Nov 3, 2004
Sold by
Mcneilly Robert E
Bought by
Mcneilly Robert E and Mary Katherine Mcneilly Family Trust
Purchase Details
Closed on
Mar 3, 1994
Sold by
Harrell Dan E
Bought by
White Houston W Etux
Create a Home Valuation Report for This Property
The Home Valuation Report is an in-depth analysis detailing your home's value as well as a comparison with similar homes in the area
Home Values in the Area
Average Home Value in this Area
Purchase History
| Date | Buyer | Sale Price | Title Company |
|---|---|---|---|
| Greenberg Elliot S | -- | Chapman & Rosenthal Title In | |
| Greenberg Elliott G | $1,000,000 | -- | |
| Mcneilly Robert E | -- | -- | |
| Mcneilly Robert E | -- | -- | |
| White Houston W Etux | $300,000 | -- |
Source: Public Records
Mortgage History
| Date | Status | Borrower | Loan Amount |
|---|---|---|---|
| Previous Owner | Greenberg Elliott G | $800,000 | |
| Previous Owner | Mcneilly Robert E | $449,002 |
Source: Public Records
Tax History Compared to Growth
Tax History
| Year | Tax Paid | Tax Assessment Tax Assessment Total Assessment is a certain percentage of the fair market value that is determined by local assessors to be the total taxable value of land and additions on the property. | Land | Improvement |
|---|---|---|---|---|
| 2024 | $25,214 | $862,900 | $391,325 | $471,575 |
| 2023 | $25,214 | $862,900 | $391,325 | $471,575 |
| 2022 | $25,214 | $862,900 | $391,325 | $471,575 |
| 2021 | $25,481 | $862,900 | $391,325 | $471,575 |
| 2020 | $27,445 | $671,350 | $255,750 | $415,600 |
| 2019 | $20,510 | $671,350 | $255,750 | $415,600 |
| 2018 | $18,496 | $671,350 | $255,750 | $415,600 |
| 2017 | $18,496 | $671,350 | $255,750 | $415,600 |
| 2016 | $21,805 | $555,675 | $223,900 | $331,775 |
| 2015 | $21,805 | $555,675 | $223,900 | $331,775 |
| 2014 | $21,805 | $555,675 | $223,900 | $331,775 |
Source: Public Records
Map
Nearby Homes
- 600 Westview Ave
- 4410 Truxton Place
- 438 Lynnwood Blvd
- 4307 Sunnybrook Dr
- 504 Lynnwood Blvd
- 416 Lynnwood Blvd
- 404 Lynnwood Blvd
- 614 Westview Ave
- 541 Jackson Blvd
- 602 Lynnwood Blvd
- 625 Westview Ave
- 533 Belle Meade Blvd
- 3920 Dorcas Dr
- 138 Prospect Hill
- 143 Prospect Hill
- 4306 Lillywood Rd
- 3803 Woodmont Ln Unit A
- 4430 Sheppard Place
- 216 Chestnut Hill Dr
- 218 Deer Park Dr
- 501 Westview Ave
- 4333 Glen Eden Dr
- 437 Westview Ave
- 505 Westview Ave
- 4322 Glen Eden Dr
- 433 Westview Ave
- 438 Westview Ave
- 4326 Glen Eden Dr
- 4319 Glen Eden Dr
- 4343 Glen Eden Dr
- 436 Westview Ave
- 515 Westview Ave
- 504 Westview Ave
- 429 Westview Ave
- 434 Westview Ave
- 4314 Glen Eden Dr
- 520 Jackson Blvd
- 4317 Glen Eden Dr
- 4324 Signal Hill Dr
- 432 Westview Ave