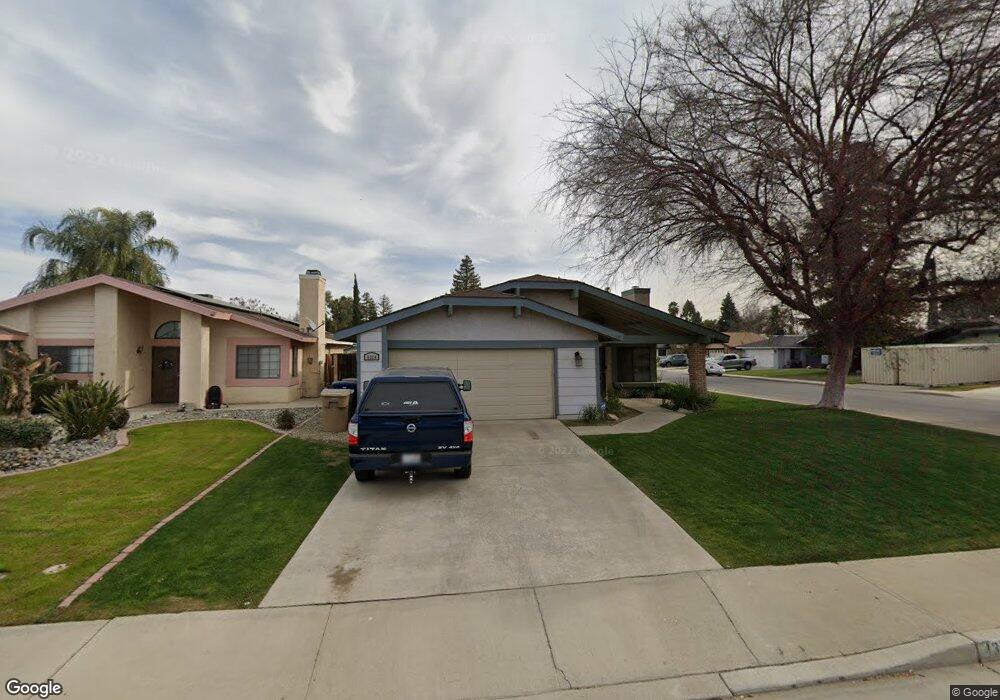
4324 Appleton Way Bakersfield, CA 93311
Gosford NeighborhoodEstimated Value: $352,000 - $385,000
3
Beds
2
Baths
1,350
Sq Ft
$276/Sq Ft
Est. Value
About This Home
This home is located at 4324 Appleton Way, Bakersfield, CA 93311 and is currently estimated at $372,043, approximately $275 per square foot. 4324 Appleton Way is a home located in Kern County with nearby schools including Sing Lum Elementary School, Tevis Junior High School, and Stockdale High School.
Ownership History
Date
Name
Owned For
Owner Type
Purchase Details
Closed on
Jan 29, 2010
Sold by
Henry Jason M and Henry Jamie L
Bought by
Carter Sheri L
Current Estimated Value
Home Financials for this Owner
Home Financials are based on the most recent Mortgage that was taken out on this home.
Original Mortgage
$141,839
Outstanding Balance
$94,295
Interest Rate
5.12%
Mortgage Type
FHA
Estimated Equity
$277,748
Purchase Details
Closed on
May 28, 2002
Sold by
Munoz Ernesto and Munoz Dora L
Bought by
Henry Jason M and Henry Jamie L
Home Financials for this Owner
Home Financials are based on the most recent Mortgage that was taken out on this home.
Original Mortgage
$123,830
Interest Rate
6.89%
Mortgage Type
FHA
Create a Home Valuation Report for This Property
The Home Valuation Report is an in-depth analysis detailing your home's value as well as a comparison with similar homes in the area
Home Values in the Area
Average Home Value in this Area
Purchase History
| Date | Buyer | Sale Price | Title Company |
|---|---|---|---|
| Carter Sheri L | $144,500 | Placer Title Company | |
| Henry Jason M | $125,000 | American Title Co |
Source: Public Records
Mortgage History
| Date | Status | Borrower | Loan Amount |
|---|---|---|---|
| Open | Carter Sheri L | $141,839 | |
| Previous Owner | Henry Jason M | $123,830 |
Source: Public Records
Tax History
| Year | Tax Paid | Tax Assessment Tax Assessment Total Assessment is a certain percentage of the fair market value that is determined by local assessors to be the total taxable value of land and additions on the property. | Land | Improvement |
|---|---|---|---|---|
| 2025 | $3,195 | $211,018 | $64,533 | $146,485 |
| 2024 | $3,145 | $206,882 | $63,268 | $143,614 |
| 2023 | $3,145 | $202,827 | $62,028 | $140,799 |
| 2022 | $3,019 | $198,852 | $60,812 | $138,040 |
| 2021 | $2,903 | $194,955 | $59,620 | $135,335 |
| 2020 | $2,852 | $192,957 | $59,009 | $133,948 |
| 2019 | $2,814 | $192,957 | $59,009 | $133,948 |
| 2018 | $2,692 | $185,467 | $56,718 | $128,749 |
| 2017 | $2,653 | $181,831 | $55,606 | $126,225 |
| 2016 | $2,489 | $178,267 | $54,516 | $123,751 |
| 2015 | $2,466 | $175,591 | $53,698 | $121,893 |
| 2014 | $2,407 | $172,153 | $52,647 | $119,506 |
Source: Public Records
Map
Nearby Homes
- 9324 Lacroix Ct
- 9608 Lacroix Ct
- 9508 Bard Ct
- 9408 Nickam Ct
- 9601 Lanneau Ct
- 9813 Fitzgerald Dr
- 9209 Campus Park Ct
- 9905 Lightner Way
- 9008 Heely Ct
- 9320 Cadbury Dr
- 9703 Touchstone Dr
- 9711 Touchstone Dr
- 9902 Rancho Verde Dr
- 9913 Bath Ct
- 10015 Saint Albans Ave
- 4400 Cron Way
- 9400 Hemingway Place
- 10113 Saint Albans Ave
- 4600 Tobin Rd
- 8832 Sierra Oak Dr
- 4320 Appleton Way
- 9216 Hoxie Ct
- 4316 Appleton Way
- 9225 Hoxie Ct
- 9229 Hoxie Ct
- 9212 Hoxie Ct
- 4312 Appleton Way
- 9221 Hoxie Ct
- 4313 Appleton Way
- 4309 Appleton Way
- 9421 Bamborough Ct
- 9217 Hoxie Ct
- 9425 Bamborough Ct
- 4305 Appleton Way
- 4401 Appleton Way
- 9208 Hoxie Ct
- 4308 Appleton Way
- 9213 Hoxie Ct
- 4405 Appleton Way
- 4301 Appleton Way
Your Personal Tour Guide
Ask me questions while you tour the home.