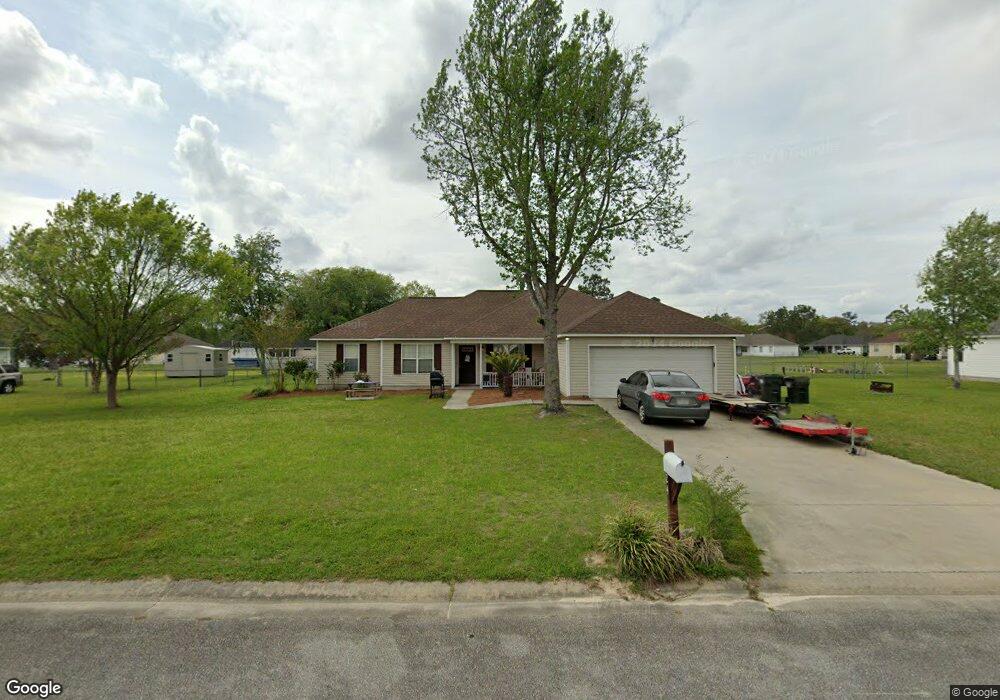
4324 Summerlin Dr Valdosta, GA 31605
Estimated Value: $235,000 - $266,000
4
Beds
2
Baths
1,801
Sq Ft
$139/Sq Ft
Est. Value
About This Home
This home is located at 4324 Summerlin Dr, Valdosta, GA 31605 and is currently estimated at $250,483, approximately $139 per square foot. 4324 Summerlin Dr is a home located in Lowndes County with nearby schools including Moulton-Branch Elementary School, Pine Grove Middle School, and Lowndes High School.
Ownership History
Date
Name
Owned For
Owner Type
Purchase Details
Closed on
Jul 5, 2017
Sold by
Ard Christopher Wade
Bought by
Mckeller Ard Dorothy
Current Estimated Value
Purchase Details
Closed on
Aug 31, 2015
Sold by
Masters Daniel G
Bought by
Ard Christopher
Home Financials for this Owner
Home Financials are based on the most recent Mortgage that was taken out on this home.
Original Mortgage
$110,400
Interest Rate
3.95%
Mortgage Type
New Conventional
Purchase Details
Closed on
Feb 21, 2002
Sold by
Edner Carolyn E
Bought by
Masters Daniel G and Masters Paige D
Purchase Details
Closed on
Sep 9, 2001
Sold by
Nelco Inc
Bought by
Edner Carolyn E
Purchase Details
Closed on
Mar 29, 2001
Sold by
Dhr Inc
Bought by
Nelco Inc
Purchase Details
Closed on
Oct 16, 1997
Sold by
Vallotton Robert and Vallotton Joseph
Bought by
Dhr Inc
Create a Home Valuation Report for This Property
The Home Valuation Report is an in-depth analysis detailing your home's value as well as a comparison with similar homes in the area
Home Values in the Area
Average Home Value in this Area
Purchase History
| Date | Buyer | Sale Price | Title Company |
|---|---|---|---|
| Mckeller Ard Dorothy | $133,000 | -- | |
| Ard Christopher | $138,000 | -- | |
| Masters Daniel G | $118,000 | -- | |
| Edner Carolyn E | $114,500 | -- | |
| Nelco Inc | $310,000 | -- | |
| Dhr Inc | -- | -- |
Source: Public Records
Mortgage History
| Date | Status | Borrower | Loan Amount |
|---|---|---|---|
| Previous Owner | Ard Christopher | $110,400 |
Source: Public Records
Tax History Compared to Growth
Tax History
| Year | Tax Paid | Tax Assessment Tax Assessment Total Assessment is a certain percentage of the fair market value that is determined by local assessors to be the total taxable value of land and additions on the property. | Land | Improvement |
|---|---|---|---|---|
| 2024 | $2,005 | $82,480 | $11,800 | $70,680 |
| 2023 | $2,005 | $82,480 | $11,800 | $70,680 |
| 2022 | $1,703 | $59,746 | $11,800 | $47,946 |
| 2021 | $1,777 | $59,746 | $11,800 | $47,946 |
| 2020 | $1,653 | $59,754 | $11,800 | $47,954 |
| 2019 | $1,500 | $53,531 | $11,800 | $41,731 |
| 2018 | $1,515 | $53,538 | $11,800 | $41,738 |
| 2017 | $1,364 | $53,546 | $11,800 | $41,746 |
| 2016 | $1,414 | $55,355 | $11,800 | $43,555 |
| 2015 | -- | $56,666 | $11,800 | $44,866 |
| 2014 | $1,424 | $56,666 | $11,800 | $44,866 |
Source: Public Records
Map
Nearby Homes
- 3937 Studstill Rd
- 6416 Abney Ct
- 6408 Abney Ct
- 6424 Abney Ct
- 6428 Abney Ct
- 3915 Studstill Rd
- 3908 Crusader Ct
- 4035 Stratford Cir
- 3920 Bull Run
- 3917 Valiant Ct
- 3376 Bemiss Knights Academy Rd
- 3885 Brookfield Dr
- 4008 Muirfield Ln
- 3967 Stratford Cir
- 3789 Heatherwoods Dr
- 3735 Studstill Rd
- 3853 Stratford Cir
- 3747 Robin Ln
- 3713 Robin Ln
- 3904 Countess Ct
- 4320 Summerlin Dr
- 4328 Summerlin Dr
- 4512 Windward Ct
- 4325 Summerlin Dr
- 4516 Windward Ct
- 4316 Summerlin Dr
- 4396 Summerlin Dr
- 4332 Summerlin Dr
- 4392 Summerlin Dr
- 4508 Windward Ct
- 4401 Wiregrass Cir
- 4249 Shadowwood Dr
- 4400 Summerlin Dr
- 4517 Windward Ct
- 4504 Windward Ct
- 4388 Summerlin Dr
- 4405 Wiregrass Cir
- 4338 Summerlin Dr
- 4405 Wiregrass Cir
- 4245 Shadowwood Dr