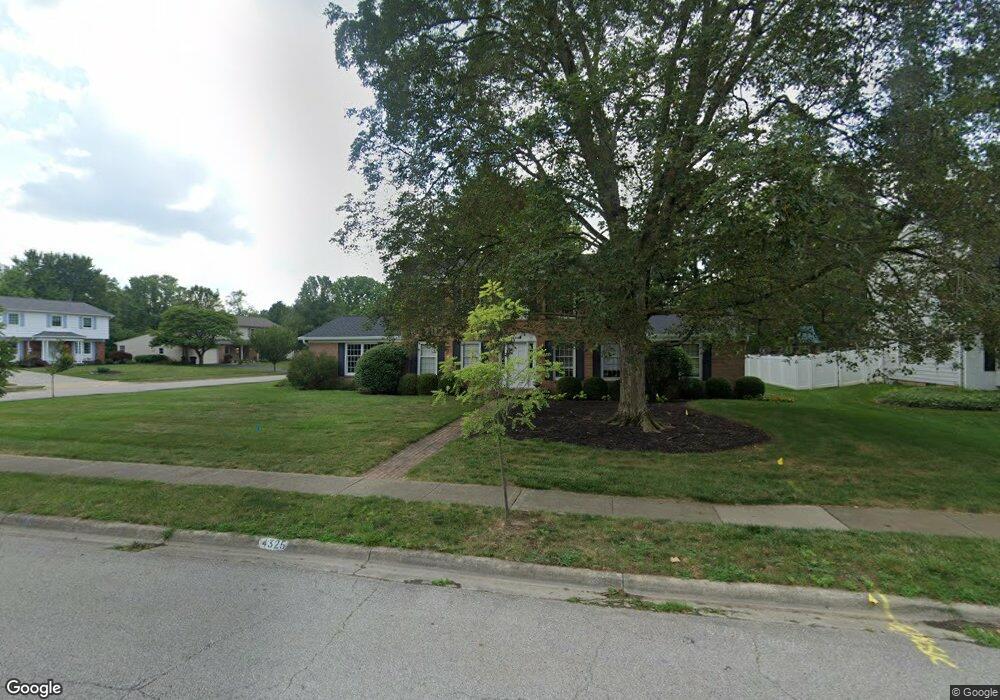
4325 Crown Point Dr Columbus, OH 43220
Estimated Value: $599,000 - $892,000
3
Beds
3
Baths
3,021
Sq Ft
$252/Sq Ft
Est. Value
About This Home
This home is located at 4325 Crown Point Dr, Columbus, OH 43220 and is currently estimated at $762,533, approximately $252 per square foot. 4325 Crown Point Dr is a home located in Franklin County with nearby schools including Windermere Elementary School, Hastings Middle School, and Upper Arlington High School.
Ownership History
Date
Name
Owned For
Owner Type
Purchase Details
Closed on
Mar 2, 1999
Sold by
Budd Philip N and Budd Stacey M
Bought by
Amling Paul J and Amling Julie A
Current Estimated Value
Home Financials for this Owner
Home Financials are based on the most recent Mortgage that was taken out on this home.
Original Mortgage
$236,700
Outstanding Balance
$52,621
Interest Rate
6.8%
Estimated Equity
$709,912
Purchase Details
Closed on
May 29, 1997
Sold by
Simon Yvonne E
Bought by
Budd Philip N and Budd Stacey M
Home Financials for this Owner
Home Financials are based on the most recent Mortgage that was taken out on this home.
Original Mortgage
$218,400
Interest Rate
7.87%
Purchase Details
Closed on
Mar 29, 1988
Create a Home Valuation Report for This Property
The Home Valuation Report is an in-depth analysis detailing your home's value as well as a comparison with similar homes in the area
Home Values in the Area
Average Home Value in this Area
Purchase History
| Date | Buyer | Sale Price | Title Company |
|---|---|---|---|
| Amling Paul J | $278,500 | Chicago Title | |
| Budd Philip N | $242,700 | -- | |
| -- | -- | -- |
Source: Public Records
Mortgage History
| Date | Status | Borrower | Loan Amount |
|---|---|---|---|
| Open | Amling Paul J | $236,700 | |
| Closed | Budd Philip N | $218,400 |
Source: Public Records
Tax History
| Year | Tax Paid | Tax Assessment Tax Assessment Total Assessment is a certain percentage of the fair market value that is determined by local assessors to be the total taxable value of land and additions on the property. | Land | Improvement |
|---|---|---|---|---|
| 2025 | $12,725 | $219,810 | $85,020 | $134,790 |
| 2024 | $12,725 | $219,810 | $85,020 | $134,790 |
| 2023 | $12,568 | $219,800 | $85,015 | $134,785 |
| 2022 | $12,001 | $171,750 | $62,900 | $108,850 |
| 2021 | $10,624 | $171,750 | $62,900 | $108,850 |
| 2020 | $10,530 | $171,750 | $62,900 | $108,850 |
| 2019 | $9,730 | $140,320 | $62,900 | $77,420 |
| 2018 | $9,115 | $140,320 | $62,900 | $77,420 |
| 2017 | $9,109 | $140,320 | $62,900 | $77,420 |
| 2016 | $8,563 | $129,510 | $36,230 | $93,280 |
| 2015 | $8,556 | $129,510 | $36,230 | $93,280 |
| 2014 | $8,565 | $129,510 | $36,230 | $93,280 |
| 2013 | $4,090 | $117,740 | $32,935 | $84,805 |
Source: Public Records
Map
Nearby Homes
- 1605 Lafayette Dr Unit 1605
- 1594 Lafayette Dr Unit 1594
- 2200 Nayland Rd
- 1435 Havencrest Ct
- 4370 Harborough Rd
- 2411 Sheringham Rd
- 4803 Wynwood Ct
- 1701 Moreland Dr
- 2158 Sandston Rd
- 1916 Willoway Cir S
- 2475 Mccoy Rd
- 4305 Castleton Rd
- 1883 Willoway Cir N Unit 1883
- 2242 Atlee Ct Unit 5
- 3670 Romnay Rd
- 4818 Winterset Dr Unit 820
- 2560 Chartwell Rd
- 2533 Middlesex Rd
- 1165 Highland Dr
- 1090 Woodmere Rd
- 4335 Crown Point Dr
- 1900 Brandywine Dr
- 1881 Brandywine Dr
- 4345 Crown Point Dr
- 1850 Brandywine Dr
- 1920 Brandywine Dr
- 1869 Brandywine Dr
- 1889 Brandywine Dr
- 4330 Crown Point Dr
- 1857 Brandywine Dr
- 4340 Crown Point Dr
- 4351 Crown Point Dr
- 1897 Brandywine Dr
- 1928 Brandywine Dr
- 1886 Ardwick Rd
- 1845 Brandywine Dr
- 1876 Ardwick Rd
- 1830 Brandywine Dr
- 1903 Brandywine Dr
- 4350 Crown Point Dr
Your Personal Tour Guide
Ask me questions while you tour the home.