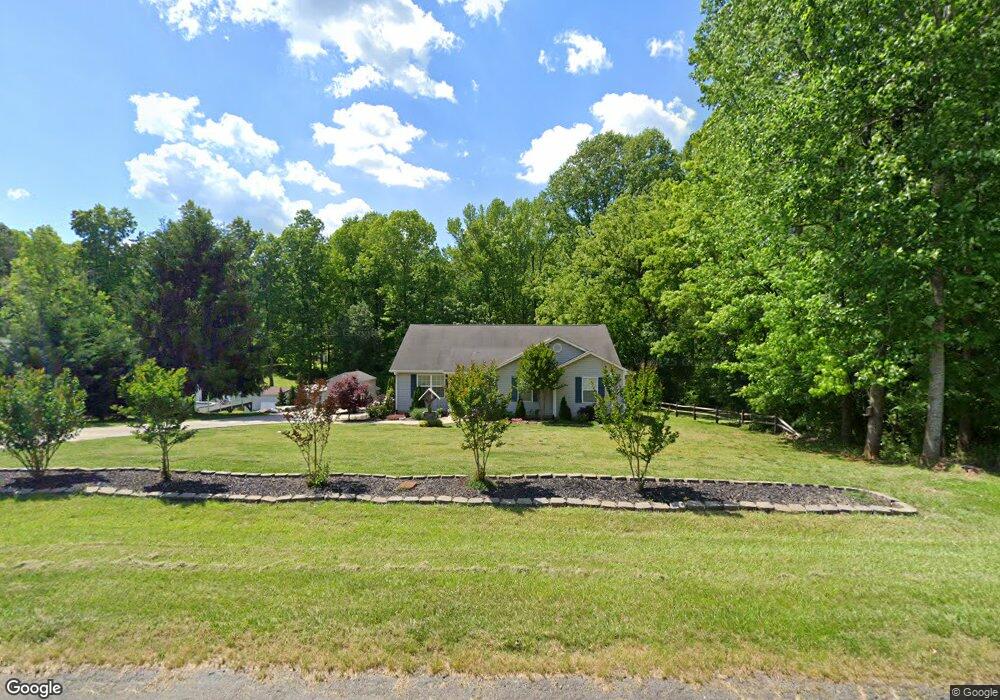
4325 Forest Manor Dr Trinity, NC 27370
Estimated Value: $297,542 - $340,000
3
Beds
2
Baths
2,000
Sq Ft
$159/Sq Ft
Est. Value
About This Home
This home is located at 4325 Forest Manor Dr, Trinity, NC 27370 and is currently estimated at $318,386, approximately $159 per square foot. 4325 Forest Manor Dr is a home located in Randolph County with nearby schools including Hopewell Elementary School, Wheatmore Middle School, and Wheatmore High School.
Ownership History
Date
Name
Owned For
Owner Type
Purchase Details
Closed on
Aug 8, 2017
Sold by
Lowder Marcus Corey and Lowder Rehbecca Annette
Bought by
King Darlene Lowder
Current Estimated Value
Home Financials for this Owner
Home Financials are based on the most recent Mortgage that was taken out on this home.
Original Mortgage
$131,313
Outstanding Balance
$109,189
Interest Rate
3.92%
Mortgage Type
New Conventional
Estimated Equity
$209,197
Purchase Details
Closed on
May 24, 2007
Sold by
Whitehead Jeffrey Darren and Whitehead Michele W
Bought by
Lowder Marcus C and Lowder Rehbecca
Home Financials for this Owner
Home Financials are based on the most recent Mortgage that was taken out on this home.
Original Mortgage
$182,000
Interest Rate
10.45%
Mortgage Type
Balloon
Purchase Details
Closed on
Mar 30, 1999
Bought by
Lowder Marcus C Lowder Rehbecca
Purchase Details
Closed on
Aug 3, 1989
Bought by
Lowder Marcus C Lowder Rehbecca
Create a Home Valuation Report for This Property
The Home Valuation Report is an in-depth analysis detailing your home's value as well as a comparison with similar homes in the area
Home Values in the Area
Average Home Value in this Area
Purchase History
| Date | Buyer | Sale Price | Title Company |
|---|---|---|---|
| King Darlene Lowder | $130,000 | None Available | |
| Lowder Marcus C | $177,000 | None Available | |
| Lowder Marcus C Lowder Rehbecca | $20,000 | -- | |
| Lowder Marcus C Lowder Rehbecca | -- | -- |
Source: Public Records
Mortgage History
| Date | Status | Borrower | Loan Amount |
|---|---|---|---|
| Open | King Darlene Lowder | $131,313 | |
| Previous Owner | Lowder Marcus C | $182,000 |
Source: Public Records
Tax History
| Year | Tax Paid | Tax Assessment Tax Assessment Total Assessment is a certain percentage of the fair market value that is determined by local assessors to be the total taxable value of land and additions on the property. | Land | Improvement |
|---|---|---|---|---|
| 2025 | $1,928 | $232,210 | $44,070 | $188,140 |
| 2024 | $1,905 | $232,210 | $44,070 | $188,140 |
| 2023 | $1,905 | $232,210 | $44,070 | $188,140 |
| 2022 | $1,524 | $156,310 | $20,160 | $136,150 |
| 2021 | $1,524 | $156,310 | $20,160 | $136,150 |
| 2020 | $1,513 | $156,310 | $20,160 | $136,150 |
| 2019 | $1,513 | $156,310 | $20,160 | $136,150 |
| 2018 | $1,535 | $153,850 | $20,160 | $133,690 |
| 2016 | $1,499 | $153,845 | $20,160 | $133,685 |
| 2015 | $1,502 | $153,845 | $20,160 | $133,685 |
| 2014 | $1,502 | $153,845 | $20,160 | $133,685 |
Source: Public Records
Map
Nearby Homes
- 4253 Fairwood Dr
- 6265 Lowerywood Cir
- 4243 Dawnwood Dr
- 4177 Dawnwood Dr
- Lot 12 Bellawood Dr
- 3856 Azalea Ln
- 4588 Red Oak Dr
- 5406 Finch Farm Rd
- 6947 Saddlebred Dr
- 6953 Quarter Horse Dr
- 4236 Arable St Unit 228
- 4218 Arable St Unit 222
- 4620 Red Oak Dr
- 4624 Old Hopewell Church Rd
- 4850 Hopewell Church Rd
- 6821 Stone Gables Dr
- 6901 Stone Gables Dr
- 3954 Evergreen Dr
- 7307 Lansdowne Place
- 5030 Brook Cir
- 4319 Forest Manor Dr
- 4349 Forest Manor Dr
- 4337 Forest Manor Dr
- 4269 Forest Manor Dr
- 4328 Forest Manor Dr
- 4336 Forest Manor Dr
- 4353 Forest Manor Dr
- 4308 Forest Manor Dr
- 4352 Forest Manor Dr
- 4248 Forest Manor Dr
- 4364 Forest Manor Dr
- 4259 Forest Manor Dr
- 4304 Forest Manor Dr
- 4361 Forest Manor Dr
- 4175 Oak Haven Dr
- 4354 Forest Manor Dr
- 4302 Forest Manor Dr
- 4165 Oak Haven Dr
- 4201 Oak Haven Dr
- 4259 Forest
Your Personal Tour Guide
Ask me questions while you tour the home.