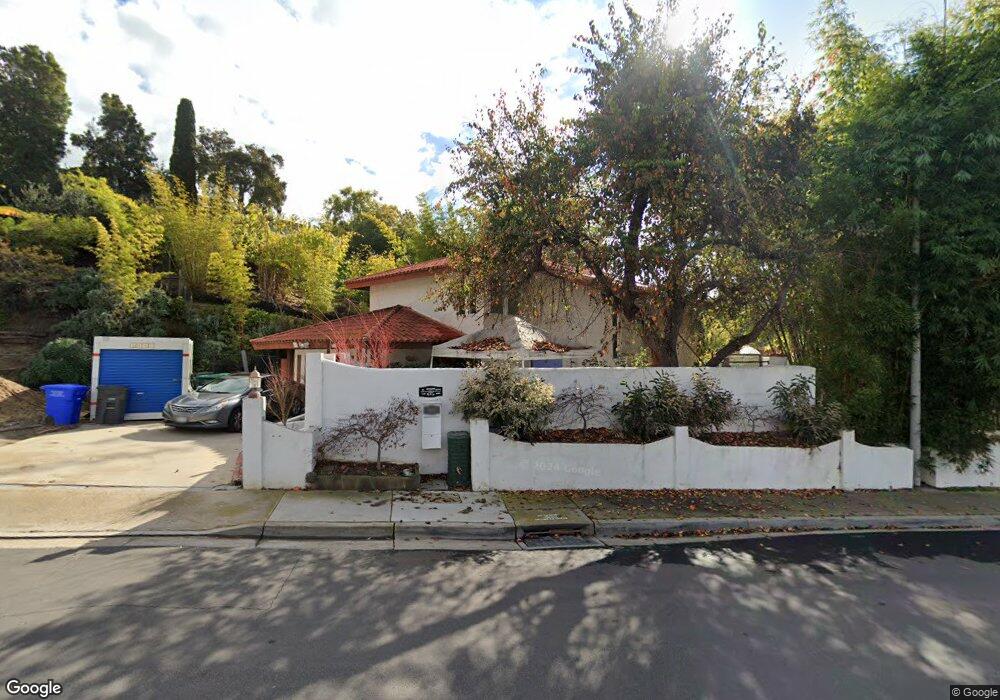
4325 Hillside Dr Unit 2 Carlsbad, CA 92008
Hedionda Point NeighborhoodEstimated Value: $1,419,451 - $1,555,000
3
Beds
3
Baths
1,635
Sq Ft
$911/Sq Ft
Est. Value
About This Home
This home is located at 4325 Hillside Dr Unit 2, Carlsbad, CA 92008 and is currently estimated at $1,489,113, approximately $910 per square foot. 4325 Hillside Dr Unit 2 is a home located in San Diego County with nearby schools including Kelly Elementary School, Carlsbad High School, and Sage Creek High.
Ownership History
Date
Name
Owned For
Owner Type
Purchase Details
Closed on
Jun 27, 2002
Sold by
Sarabi Borsu Ghazanrafi and Mafinezam Popak
Bought by
Verkade Drew and Verkade Jinguei
Current Estimated Value
Home Financials for this Owner
Home Financials are based on the most recent Mortgage that was taken out on this home.
Original Mortgage
$346,400
Outstanding Balance
$146,846
Interest Rate
6.71%
Estimated Equity
$1,342,267
Purchase Details
Closed on
May 28, 1999
Sold by
Johnson Gloria A and Johnson Gloria A
Bought by
Sarabi Borsu Ghazanfari and Mafinezam Popak
Home Financials for this Owner
Home Financials are based on the most recent Mortgage that was taken out on this home.
Original Mortgage
$114,000
Interest Rate
7.01%
Mortgage Type
Stand Alone First
Purchase Details
Closed on
Oct 4, 1985
Purchase Details
Closed on
Sep 11, 1985
Create a Home Valuation Report for This Property
The Home Valuation Report is an in-depth analysis detailing your home's value as well as a comparison with similar homes in the area
Home Values in the Area
Average Home Value in this Area
Purchase History
| Date | Buyer | Sale Price | Title Company |
|---|---|---|---|
| Verkade Drew | $433,000 | California Title Company | |
| Sarabi Borsu Ghazanfari | $284,000 | Chicago Title Co | |
| -- | $144,500 | -- | |
| -- | $122,000 | -- |
Source: Public Records
Mortgage History
| Date | Status | Borrower | Loan Amount |
|---|---|---|---|
| Open | Verkade Drew | $346,400 | |
| Previous Owner | Sarabi Borsu Ghazanfari | $114,000 | |
| Closed | Verkade Drew | $64,950 |
Source: Public Records
Tax History
| Year | Tax Paid | Tax Assessment Tax Assessment Total Assessment is a certain percentage of the fair market value that is determined by local assessors to be the total taxable value of land and additions on the property. | Land | Improvement |
|---|---|---|---|---|
| 2025 | $6,562 | $627,108 | $362,075 | $265,033 |
| 2024 | $6,562 | $614,813 | $354,976 | $259,837 |
| 2023 | $6,527 | $602,759 | $348,016 | $254,743 |
| 2022 | $6,426 | $590,942 | $341,193 | $249,749 |
| 2021 | $6,377 | $579,355 | $334,503 | $244,852 |
| 2020 | $6,333 | $573,416 | $331,074 | $242,342 |
| 2019 | $6,219 | $562,174 | $324,583 | $237,591 |
| 2018 | $5,957 | $551,152 | $318,219 | $232,933 |
| 2017 | $90 | $540,346 | $311,980 | $228,366 |
| 2016 | $5,622 | $529,752 | $305,863 | $223,889 |
| 2015 | $5,599 | $521,795 | $301,269 | $220,526 |
| 2014 | $5,505 | $511,575 | $295,368 | $216,207 |
Source: Public Records
Map
Nearby Homes
- 4269 Hillside Dr
- 1741 Bruce Rd
- 0 Hoover St
- 1095 Hoover St
- 4556 Cove Dr
- 4627 Park Dr
- 4505 Coastline Ave
- 0 Adams St Unit OC24201399
- 4235 Harrison St
- 4135 Skyline Rd
- 4705 Marina Dr Unit 7
- 4705 Marina Dr Unit 10
- 4007 Bluff View Way
- 4031 Aidan Cir Unit 1205
- 4623 Telescope Ave
- 1199 Tamarack Ave
- 4747 Marina Dr Unit 23
- 4781 Argosy Ln
- 3880 Adams St
- 4735 Bryce Cir
- 4319 Yuki Ln
- 4348 Yuki Ln
- 4329 Yuki Ln
- 4248 Park Dr
- 4400 Yuki Ln
- 4400 Yuki Ln Unit (PARK)
- 4225 Isle Dr Unit 2
- 4388 Yuki Ln
- 4329 Hillside Dr
- 4339 Yuki Ln
- 4246 Park Dr
- 4200 Parkside Place
- 4223 Isle Dr
- 4390 Yuki Ln
- 4221 Isle Dr
- 4244 Park Dr Unit 2
- 4303 Sea Bright Dr
- 4331 Hillside Dr
- 4275 Hillside Dr
- 4349 Yuki Ln
Your Personal Tour Guide
Ask me questions while you tour the home.