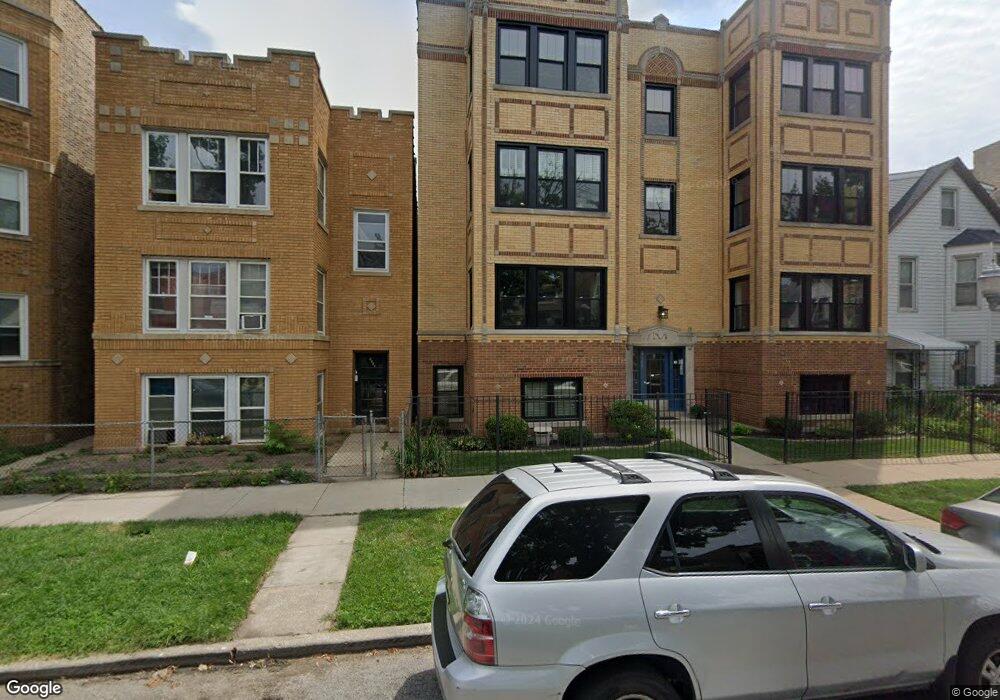
4325 N Troy St Unit 1 Chicago, IL 60618
Irving Park NeighborhoodEstimated Value: $340,000 - $426,000
2
Beds
2
Baths
1,400
Sq Ft
$270/Sq Ft
Est. Value
About This Home
This home is located at 4325 N Troy St Unit 1, Chicago, IL 60618 and is currently estimated at $377,528, approximately $269 per square foot. 4325 N Troy St Unit 1 is a home located in Cook County with nearby schools including Bateman Elementary School and Roosevelt High School.
Ownership History
Date
Name
Owned For
Owner Type
Purchase Details
Closed on
May 22, 2017
Sold by
Hedderman Andrew and Hedderman Glennys
Bought by
Retzlaff Michelle
Current Estimated Value
Home Financials for this Owner
Home Financials are based on the most recent Mortgage that was taken out on this home.
Original Mortgage
$288,800
Outstanding Balance
$240,041
Interest Rate
4.08%
Mortgage Type
New Conventional
Estimated Equity
$137,487
Purchase Details
Closed on
Dec 17, 2013
Sold by
Cagua Glennys G and Hedderman Glennys G
Bought by
Hedderman Andrew and Hedderman Glennys
Home Financials for this Owner
Home Financials are based on the most recent Mortgage that was taken out on this home.
Original Mortgage
$215,000
Interest Rate
4.62%
Mortgage Type
New Conventional
Purchase Details
Closed on
Dec 14, 2007
Sold by
Troy Building Llc
Bought by
Cagua Glennys G
Home Financials for this Owner
Home Financials are based on the most recent Mortgage that was taken out on this home.
Original Mortgage
$232,800
Interest Rate
6.27%
Mortgage Type
Unknown
Create a Home Valuation Report for This Property
The Home Valuation Report is an in-depth analysis detailing your home's value as well as a comparison with similar homes in the area
Home Values in the Area
Average Home Value in this Area
Purchase History
| Date | Buyer | Sale Price | Title Company |
|---|---|---|---|
| Retzlaff Michelle | -- | Chicago Title | |
| Hedderman Andrew | -- | Fidelity National Title | |
| Cagua Glennys G | $291,000 | Git |
Source: Public Records
Mortgage History
| Date | Status | Borrower | Loan Amount |
|---|---|---|---|
| Open | Retzlaff Michelle | $288,800 | |
| Previous Owner | Hedderman Andrew | $215,000 | |
| Previous Owner | Cagua Glennys G | $232,800 |
Source: Public Records
Tax History Compared to Growth
Tax History
| Year | Tax Paid | Tax Assessment Tax Assessment Total Assessment is a certain percentage of the fair market value that is determined by local assessors to be the total taxable value of land and additions on the property. | Land | Improvement |
|---|---|---|---|---|
| 2024 | $4,655 | $27,812 | $5,204 | $22,608 |
| 2023 | $4,516 | $25,300 | $4,197 | $21,103 |
| 2022 | $4,516 | $25,300 | $4,197 | $21,103 |
| 2021 | $4,533 | $25,299 | $4,197 | $21,102 |
| 2020 | $5,089 | $25,869 | $1,846 | $24,023 |
| 2019 | $5,115 | $28,806 | $1,846 | $26,960 |
| 2018 | $5,028 | $28,806 | $1,846 | $26,960 |
| 2017 | $3,396 | $19,097 | $1,678 | $17,419 |
| 2016 | $3,336 | $19,097 | $1,678 | $17,419 |
| 2015 | $3,029 | $19,097 | $1,678 | $17,419 |
| 2014 | $2,827 | $17,749 | $1,510 | $16,239 |
| 2013 | $2,760 | $17,749 | $1,510 | $16,239 |
Source: Public Records
Map
Nearby Homes
- 4307 N Troy St Unit 1
- 4333 N Troy St Unit 3E
- 4231 N Kedzie Ave Unit 3E
- 4229 N Kedzie Ave
- 4410 N Troy St Unit 101
- 3102 W Berteau Ave Unit 31023
- 4248 N Sawyer Ave
- 3222 W Berteau Ave Unit 2
- 4141 N Kedzie Ave Unit 307
- 4438 N Kedzie Ave Unit G-1
- 4343 N Sacramento Ave Unit A-G
- 4437 N Whipple St
- 4411 N Sacramento Ave Unit 1
- 3055 W Sunnyside Ave Unit 1
- 3247 W Berteau Ave
- 4347 N Richmond St Unit 1N
- 4347 N Richmond St Unit 1S
- 4347 N Richmond St Unit 3N
- 4347 N Richmond St Unit 2N
- 4116 N Kedzie Ave
- 4325 N Troy St Unit 43252
- 4325 N Troy St Unit 43251
- 4325 N Troy St Unit 4325G
- 4325 N Troy St Unit 43253
- 4325 N Troy St Unit G
- 4325 N Troy St Unit 3
- 4323 N Troy St Unit 1
- 4323 N Troy St Unit 4323G
- 4323 N Troy St Unit 43233
- 4323 N Troy St Unit 43232
- 4323 N Troy St Unit 43231
- 4323 N Troy St Unit 3
- 4323 N Troy St Unit 2
- 4323 N Troy St Unit G
- 4327 N Troy St
- 4327 N Troy St
- 4319 N Troy St
- 4329 N Troy St
- 4329 N Troy St
- 4317 N Troy St