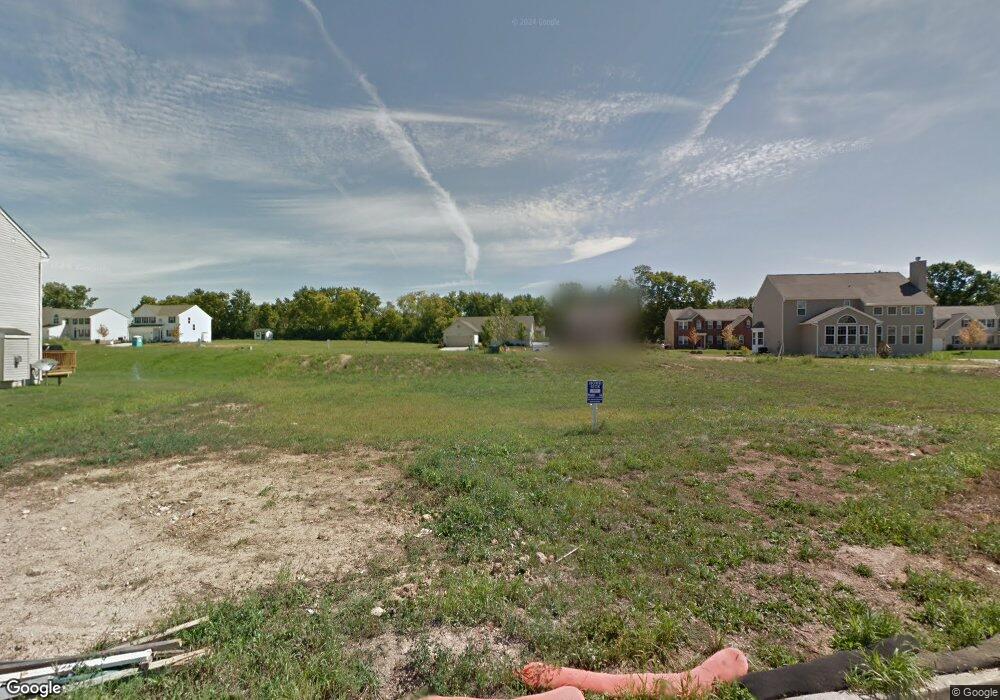
4325 Sourwood Dr Dayton, OH 45424
Forest Ridge Quail Hollow NeighborhoodEstimated Value: $377,000 - $412,000
4
Beds
4
Baths
2,860
Sq Ft
$136/Sq Ft
Est. Value
About This Home
This home is located at 4325 Sourwood Dr, Dayton, OH 45424 and is currently estimated at $389,707, approximately $136 per square foot. 4325 Sourwood Dr is a home located in Montgomery County with nearby schools including Stebbins High School, Pathway School of Discovery, and St. Helen Elementary School.
Ownership History
Date
Name
Owned For
Owner Type
Purchase Details
Closed on
Mar 12, 2021
Sold by
Parker Darnell Dwayne and Delparker Luz Del
Bought by
Patrick John
Current Estimated Value
Home Financials for this Owner
Home Financials are based on the most recent Mortgage that was taken out on this home.
Original Mortgage
$252,000
Outstanding Balance
$226,658
Interest Rate
2.9%
Mortgage Type
New Conventional
Estimated Equity
$163,049
Purchase Details
Closed on
Jun 14, 2016
Sold by
Smith Melissa M and Smith Jay S
Bought by
Parker Darnell Dwayne and Parker Luz Del Cielo
Home Financials for this Owner
Home Financials are based on the most recent Mortgage that was taken out on this home.
Original Mortgage
$210,429
Interest Rate
3.66%
Mortgage Type
VA
Purchase Details
Closed on
Nov 16, 2012
Sold by
Nvr Inc
Bought by
Smith Melissa M and Smith Jay S
Home Financials for this Owner
Home Financials are based on the most recent Mortgage that was taken out on this home.
Original Mortgage
$205,321
Interest Rate
3.37%
Mortgage Type
VA
Purchase Details
Closed on
Sep 4, 2012
Sold by
Lof-Arn Development Company
Bought by
Nvr Inc
Create a Home Valuation Report for This Property
The Home Valuation Report is an in-depth analysis detailing your home's value as well as a comparison with similar homes in the area
Home Values in the Area
Average Home Value in this Area
Purchase History
| Date | Buyer | Sale Price | Title Company |
|---|---|---|---|
| Patrick John | $280,000 | Landmark Ttl Agcy South Inc | |
| Parker Darnell Dwayne | $206,000 | Vantage Land Title | |
| Smith Melissa M | $201,000 | First Title Agency Inc | |
| Nvr Inc | $33,000 | First Title Agency Inc |
Source: Public Records
Mortgage History
| Date | Status | Borrower | Loan Amount |
|---|---|---|---|
| Open | Patrick John | $252,000 | |
| Previous Owner | Parker Darnell Dwayne | $210,429 | |
| Previous Owner | Smith Melissa M | $205,321 |
Source: Public Records
Tax History Compared to Growth
Tax History
| Year | Tax Paid | Tax Assessment Tax Assessment Total Assessment is a certain percentage of the fair market value that is determined by local assessors to be the total taxable value of land and additions on the property. | Land | Improvement |
|---|---|---|---|---|
| 2024 | $5,467 | $107,720 | $21,500 | $86,220 |
| 2023 | $5,467 | $107,720 | $21,500 | $86,220 |
| 2022 | $5,470 | $84,160 | $16,800 | $67,360 |
| 2021 | $5,572 | $84,160 | $16,800 | $67,360 |
| 2020 | $5,581 | $84,160 | $16,800 | $67,360 |
| 2019 | $5,416 | $73,960 | $11,200 | $62,760 |
| 2018 | $5,427 | $73,960 | $11,200 | $62,760 |
| 2017 | $5,404 | $73,960 | $11,200 | $62,760 |
| 2016 | $5,413 | $72,130 | $11,200 | $60,930 |
| 2015 | $5,334 | $72,130 | $11,200 | $60,930 |
| 2014 | $5,334 | $72,130 | $11,200 | $60,930 |
| 2012 | -- | $12,250 | $12,250 | $0 |
Source: Public Records
Map
Nearby Homes
- 3465 Berrywood Dr
- 3532 Berrywood Dr
- 5224 Sweetleaf Dr
- 2520 Harshman Rd
- 2512 Harshman Rd
- 4222 Meadowsweet Dr
- 3855 Berrywood Dr
- 4731 Blue Spruce Ct
- 0 Forest Ridge Blvd Unit 937866
- 2757 Amberwood Dr Unit 17-300
- 4799 Blue Spruce Ct
- 5027 Katherine Ct
- 4048 Quail Bush Dr
- 634 Mentor Ave
- 3535 Golden Meadows Ct
- 4363 Weeping Willow Dr
- 4369 Weeping Willow Dr
- 4830 Leafburrow Dr
- 508 Reading Rd
- 4750 Whitewood Ct
- 4317 Sourwood Dr
- 4333 Sourwood Dr
- 3509 Berrywood Dr
- 3525 Berrywood Dr
- 4330 Sourwood Dr
- 4309 Sourwood Dr
- 4322 Sourwood Dr
- 3503 Berrywood Dr
- 4338 Sourwood Dr
- 4314 Sourwood Dr
- 4344 Sourwood Dr
- 3533 Berrywood Dr
- 4303 Sourwood Dr
- 4350 Sourwood Dr
- 3541 Berrywood Dr
- 4308 Sourwood Dr
- 3516 Berrywood Dr
- 3508 Berrywood Dr
- 3485 Berrywood Dr
- 4302 Sourwood Dr