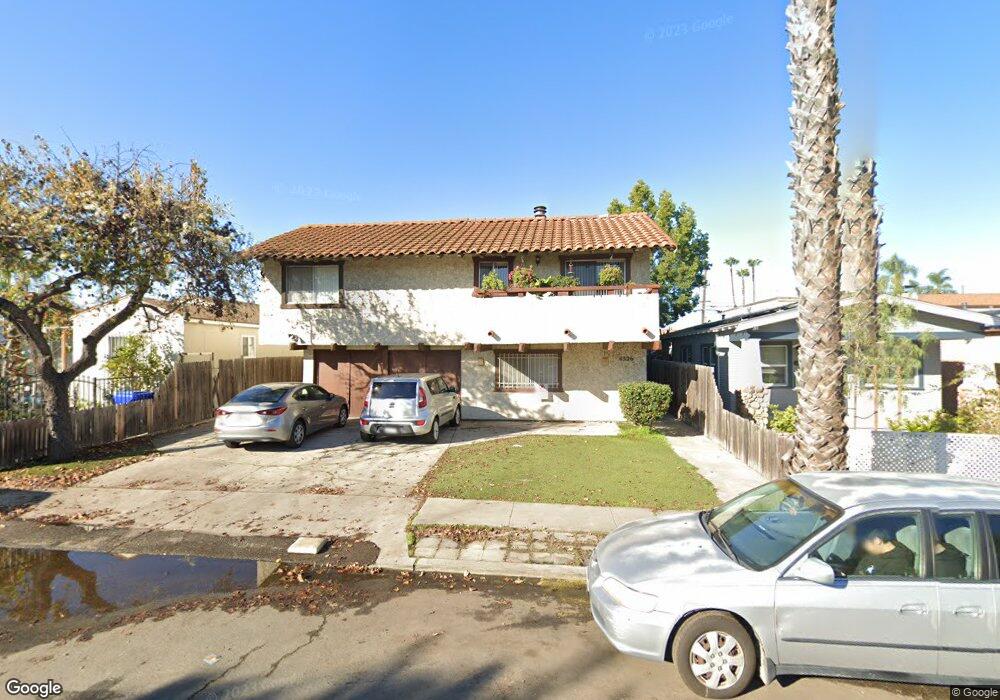
4326 Copeland Ave Unit 6 San Diego, CA 92105
Kensington NeighborhoodEstimated Value: $352,000 - $371,042
1
Bed
1
Bath
550
Sq Ft
$657/Sq Ft
Est. Value
About This Home
This home is located at 4326 Copeland Ave Unit 6, San Diego, CA 92105 and is currently estimated at $361,261, approximately $656 per square foot. 4326 Copeland Ave Unit 6 is a home located in San Diego County with nearby schools including Franklin Elementary School, Wilson Middle School, and Lewis Middle School.
Ownership History
Date
Name
Owned For
Owner Type
Purchase Details
Closed on
Jul 8, 2025
Sold by
Heitman Lynette Vicki
Bought by
Lynette Vicki Heitman Revocable Living Trust and Heitman
Current Estimated Value
Purchase Details
Closed on
Feb 14, 2007
Sold by
Myers Marcus V
Bought by
Heitman Lynette
Home Financials for this Owner
Home Financials are based on the most recent Mortgage that was taken out on this home.
Original Mortgage
$105,000
Interest Rate
6.18%
Mortgage Type
New Conventional
Purchase Details
Closed on
Aug 22, 2001
Sold by
Quam Donald E
Bought by
Myers Marcus
Purchase Details
Closed on
Mar 20, 2000
Sold by
Hinds Jeffrey A and Hinds Cathy J
Bought by
Quam Donald E and Myers Marcus
Home Financials for this Owner
Home Financials are based on the most recent Mortgage that was taken out on this home.
Original Mortgage
$26,250
Interest Rate
4.35%
Purchase Details
Closed on
Mar 19, 1991
Create a Home Valuation Report for This Property
The Home Valuation Report is an in-depth analysis detailing your home's value as well as a comparison with similar homes in the area
Home Values in the Area
Average Home Value in this Area
Purchase History
| Date | Buyer | Sale Price | Title Company |
|---|---|---|---|
| Lynette Vicki Heitman Revocable Living Trust | -- | None Listed On Document | |
| Heitman Lynette | $140,000 | Commonwealth Land Title Co | |
| Myers Marcus | $10,000 | First American Title Ins Co | |
| Quam Donald E | $37,500 | Fidelity National Title | |
| -- | $51,000 | -- |
Source: Public Records
Mortgage History
| Date | Status | Borrower | Loan Amount |
|---|---|---|---|
| Previous Owner | Heitman Lynette | $105,000 | |
| Previous Owner | Quam Donald E | $26,250 |
Source: Public Records
Tax History Compared to Growth
Tax History
| Year | Tax Paid | Tax Assessment Tax Assessment Total Assessment is a certain percentage of the fair market value that is determined by local assessors to be the total taxable value of land and additions on the property. | Land | Improvement |
|---|---|---|---|---|
| 2025 | $2,211 | $187,552 | $93,776 | $93,776 |
| 2024 | $2,211 | $183,876 | $91,938 | $91,938 |
| 2023 | $2,160 | $180,272 | $90,136 | $90,136 |
| 2022 | $2,101 | $176,738 | $88,369 | $88,369 |
| 2021 | $2,085 | $173,274 | $86,637 | $86,637 |
| 2020 | $2,060 | $171,498 | $85,749 | $85,749 |
| 2019 | $2,022 | $168,136 | $84,068 | $84,068 |
| 2018 | $1,890 | $164,840 | $82,420 | $82,420 |
| 2017 | $82 | $150,000 | $44,000 | $106,000 |
| 2016 | $1,420 | $125,000 | $37,000 | $88,000 |
| 2015 | $1,127 | $100,000 | $30,000 | $70,000 |
| 2014 | $895 | $80,000 | $24,000 | $56,000 |
Source: Public Records
Map
Nearby Homes
- 4445-47 42nd St
- 4251 Ethelda Place
- 4125-27 Meade Ave
- 4517 Copeland Ave
- 4146-50 Monroe Ave
- 4383-85 Central Ave
- 4329 Central Ave Unit 5
- 4510 Marlborough Dr
- 4343 44th St Unit 1
- 4119 Orange Ave
- 4220 41st St Unit 4
- 4175 Van Dyke Ave
- 4174 Marlborough Ave Unit 8
- 4153 42nd St
- 4342 Highland Ave Unit 7
- 4410-12 Highland Ave
- 4260 44th St Unit 217
- 4596 Vista St
- 4554 Marlborough Dr Unit 2
- 4146 Fairmount Ave
- 4326 Copeland Ave Unit 7
- 4326 Copeland Ave Unit 5
- 4326 Copeland Ave Unit 3
- 4326 Copeland Ave Unit 2
- 4326 Copeland Ave Unit 1
- 4326 Copeland Av #2
- 4334 Copeland Ave
- 4320 Copeland Ave
- 4338 Copeland Ave Unit 40
- 4342-56 Copeland Ave
- 4342 Copeland Ave
- 4331 42nd St Unit C
- 4305 42nd St Unit 17
- 4319 42nd St Unit 21
- 4337 42nd St
- 4325 42nd St
- 4329 Copeland Ave
- 4228 4228 El Cajon Blvd
- 4343 42nd St
- 4360 Copeland Ave