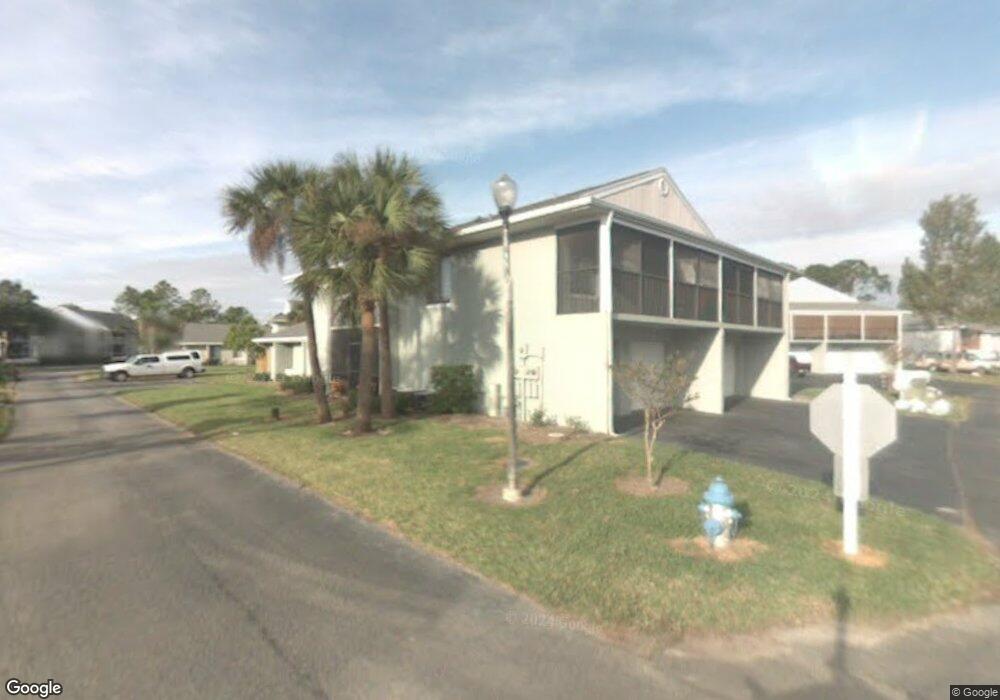
4326 Pinebark Ave Unit 801 Orlando, FL 32811
Estimated Value: $170,000 - $189,000
2
Beds
1
Bath
963
Sq Ft
$185/Sq Ft
Est. Value
About This Home
This home is located at 4326 Pinebark Ave Unit 801, Orlando, FL 32811 and is currently estimated at $177,756, approximately $184 per square foot. 4326 Pinebark Ave Unit 801 is a home located in Orange County with nearby schools including Millennia Elementary School, Dr. Phillips High School, and Southwest Middle.
Ownership History
Date
Name
Owned For
Owner Type
Purchase Details
Closed on
Dec 31, 2018
Sold by
Kumar Rajesh
Bought by
Aad Homes Inc
Current Estimated Value
Home Financials for this Owner
Home Financials are based on the most recent Mortgage that was taken out on this home.
Original Mortgage
$60,000
Outstanding Balance
$56,425
Interest Rate
9%
Mortgage Type
Purchase Money Mortgage
Estimated Equity
$121,331
Purchase Details
Closed on
Oct 28, 2010
Sold by
Technology Tool Kit Systems Llc
Bought by
Kumar Rajesh
Purchase Details
Closed on
Jan 8, 2010
Sold by
Shaikh Ferdousi
Bought by
Technology Tool Kit Systems Llc
Purchase Details
Closed on
Aug 26, 2006
Sold by
Smith Russell L
Bought by
Shaikh Ferdousi
Home Financials for this Owner
Home Financials are based on the most recent Mortgage that was taken out on this home.
Original Mortgage
$139,500
Interest Rate
7.62%
Mortgage Type
Purchase Money Mortgage
Create a Home Valuation Report for This Property
The Home Valuation Report is an in-depth analysis detailing your home's value as well as a comparison with similar homes in the area
Home Values in the Area
Average Home Value in this Area
Purchase History
| Date | Buyer | Sale Price | Title Company |
|---|---|---|---|
| Aad Homes Inc | $60,000 | Venture Title | |
| Kumar Rajesh | $24,000 | Attorney | |
| Technology Tool Kit Systems Llc | $30,000 | Florida Titlesmith Llc | |
| Shaikh Ferdousi | $155,000 | Brokers Title Of Orlando Vii |
Source: Public Records
Mortgage History
| Date | Status | Borrower | Loan Amount |
|---|---|---|---|
| Open | Aad Homes Inc | $60,000 | |
| Previous Owner | Shaikh Ferdousi | $139,500 |
Source: Public Records
Tax History Compared to Growth
Tax History
| Year | Tax Paid | Tax Assessment Tax Assessment Total Assessment is a certain percentage of the fair market value that is determined by local assessors to be the total taxable value of land and additions on the property. | Land | Improvement |
|---|---|---|---|---|
| 2025 | $2,622 | $136,411 | -- | -- |
| 2024 | $2,369 | $136,411 | -- | -- |
| 2023 | $2,369 | $154,100 | $30,820 | $123,280 |
| 2022 | $2,069 | $125,200 | $25,040 | $100,160 |
| 2021 | $1,867 | $105,900 | $21,180 | $84,720 |
| 2020 | $1,647 | $96,300 | $19,260 | $77,040 |
| 2019 | $1,513 | $77,000 | $15,400 | $61,600 |
| 2018 | $1,328 | $72,200 | $14,440 | $57,760 |
| 2017 | $1,195 | $61,600 | $12,320 | $49,280 |
| 2016 | $1,131 | $58,400 | $11,680 | $46,720 |
| 2015 | $1,100 | $58,400 | $11,680 | $46,720 |
| 2014 | $1,066 | $58,400 | $11,680 | $46,720 |
Source: Public Records
Map
Nearby Homes
- 0 Pinebark Ave
- 5564 Slash Pine Ct Unit 4
- 4284 Pinebark Ave Unit 4
- 0 White Pine Ave
- 5617 Blue Shadows Ct Unit 4
- 5627 Blue Shadows Ct Unit 3
- 4448 Pinebark Ave Unit 561
- 4457 Pinebark Ave Unit 10
- 5635 Blue Shadows Ct Unit 3
- 4406 Shadow Crest Place Unit 40-4
- 4428 Middlebrook Rd Unit 4
- 4320 Middlebrook Rd Unit 2
- 4316 S Kirkman Rd Unit 1602
- 5368 Elm Ct Unit 354
- 4328 S Kirkman Rd Unit 1
- 5377 Bamboo Ct Unit 404
- 5252 Brook Ct Unit 240
- 4360 S Kirkman Rd Unit 4
- 5341 Bamboo Ct Unit 418
- 4356 S Kirkman Rd Unit 502
- 4326 Pinebark Ave Unit 1
- 4332 Pinebark Ave Unit 4
- 4328 Pinebark Ave
- 4330 Pinebark Ave
- 4330 Pinebark Ave Unit 3
- 4318 Pinebark Ave Unit 2
- 4322 Pinebark Ave
- 4320 Pinebark Ave
- 4316 Pinebark Ave
- 4336 Pinebark Ave Unit 79-2
- 4334 Pinebark Ave Unit B1
- 4338 Pinebark Ave
- 4336 Pinebark Ave Unit 2
- 4340 Pinebark Ave
- 4340 Pinebark Ave Unit 4
- 4334 Pinebark Ave Unit 79-1
- 4338 Pinebark Ave Unit 79
- 4338 Pinebark Ave Unit 79-3
- 4363 White Pine Ave Unit 812
- 4365 White Pine Ave