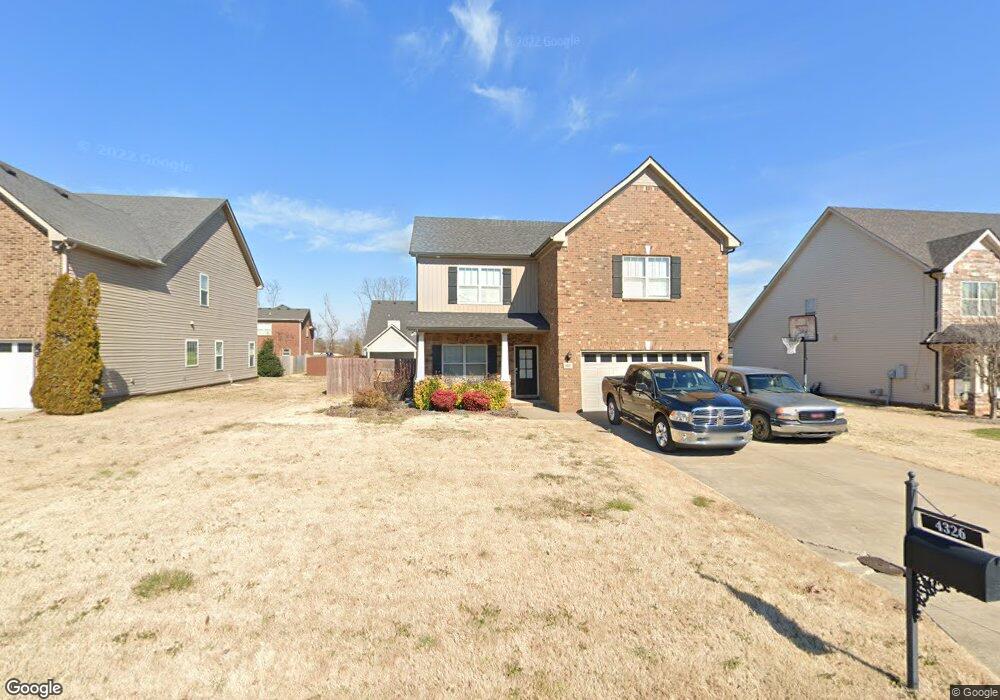
4326 Roxburghe Ct Murfreesboro, TN 37128
Estimated Value: $493,653 - $540,000
4
Beds
3
Baths
2,651
Sq Ft
$198/Sq Ft
Est. Value
About This Home
This home is located at 4326 Roxburghe Ct, Murfreesboro, TN 37128 and is currently estimated at $524,163, approximately $197 per square foot. 4326 Roxburghe Ct is a home located in Rutherford County with nearby schools including Scales Elementary School, Rockvale Elementary School, and Blackman Middle School.
Ownership History
Date
Name
Owned For
Owner Type
Purchase Details
Closed on
Sep 8, 2017
Sold by
Chickering Brian R and Chickering Jenny
Bought by
Coker Dustin and Coker Claire
Current Estimated Value
Home Financials for this Owner
Home Financials are based on the most recent Mortgage that was taken out on this home.
Original Mortgage
$279,837
Outstanding Balance
$233,809
Interest Rate
3.92%
Mortgage Type
FHA
Estimated Equity
$290,354
Purchase Details
Closed on
Apr 30, 2013
Sold by
Ole South Properties Inc
Bought by
Chickering Brian R Jenny
Home Financials for this Owner
Home Financials are based on the most recent Mortgage that was taken out on this home.
Original Mortgage
$223,708
Interest Rate
3.56%
Mortgage Type
VA
Purchase Details
Closed on
May 16, 2012
Sold by
Scottish Glen Partnership
Bought by
Ole South Properties Inc
Purchase Details
Closed on
Apr 3, 1997
Sold by
Lawrence Chruchill and Lawrence Doree
Bought by
Granville Lyons and Granville Laur
Create a Home Valuation Report for This Property
The Home Valuation Report is an in-depth analysis detailing your home's value as well as a comparison with similar homes in the area
Home Values in the Area
Average Home Value in this Area
Purchase History
| Date | Buyer | Sale Price | Title Company |
|---|---|---|---|
| Coker Dustin | $285,000 | Foundation Title & Escrow | |
| Chickering Brian R Jenny | $219,000 | -- | |
| Ole South Properties Inc | -- | -- | |
| Granville Lyons | $144,250 | -- |
Source: Public Records
Mortgage History
| Date | Status | Borrower | Loan Amount |
|---|---|---|---|
| Open | Coker Dustin | $279,837 | |
| Previous Owner | Chickering Brian R Jenny | $223,708 |
Source: Public Records
Tax History Compared to Growth
Tax History
| Year | Tax Paid | Tax Assessment Tax Assessment Total Assessment is a certain percentage of the fair market value that is determined by local assessors to be the total taxable value of land and additions on the property. | Land | Improvement |
|---|---|---|---|---|
| 2025 | $2,708 | $95,750 | $13,750 | $82,000 |
| 2024 | $2,708 | $95,750 | $13,750 | $82,000 |
| 2023 | $1,796 | $95,750 | $13,750 | $82,000 |
| 2022 | $1,548 | $95,750 | $13,750 | $82,000 |
| 2021 | $1,500 | $67,575 | $11,875 | $55,700 |
| 2020 | $1,500 | $67,575 | $11,875 | $55,700 |
| 2019 | $1,500 | $67,575 | $11,875 | $55,700 |
Source: Public Records
Map
Nearby Homes
- 4318 Roxburghe Ct
- 0 Scottish Dr
- 0 Roxburghe Ct
- 1789 Antebellum Dr
- 4510 Ropha Ct
- 4519 Sardius Dr
- 0 Old Rd S
- 412 Conhocken Ct
- 1 Old Rd S
- 1616 Alysheba Run
- 3958 Country Park Ln
- 1622 Charismatic Place
- 1708 Charismatic Place
- 3701 Country Park Ln
- 3621 Pimlico Ln
- 4719 Beryl Dr
- 783 N Farm Ct
- 3716 Pimlico Ln
- 1720 Charismatic Place
- 3903 Country Park Ln
- 4330 Roxburghe Ct
- 4322 Roxburghe Ct
- 4357 Scottish Dr
- 4334 Roxburghe Ct
- 4353 Scottish Dr
- 4361 Scottish Dr
- 4349 Scottish Dr
- 4325 Roxburghe Ct
- 4325 Roxburghe Ct (Lot #88)
- 4321 Roxburghe Ct
- 4329 Roxburghe Ct
- 4367 Scottish Dr
- 4314 Roxburghe Ct
- 4314 Roxburghe Ct (Lot 101)
- 4317 Roxburghe Ct (Lot #90)
- 4338 Roxburghe Ct
- 4317 Roxburghe Ct
- 4349 Scottish Dr (Lot 114)
- 4345 Scottish Dr
- 4373 Scottish Dr (Lot109)