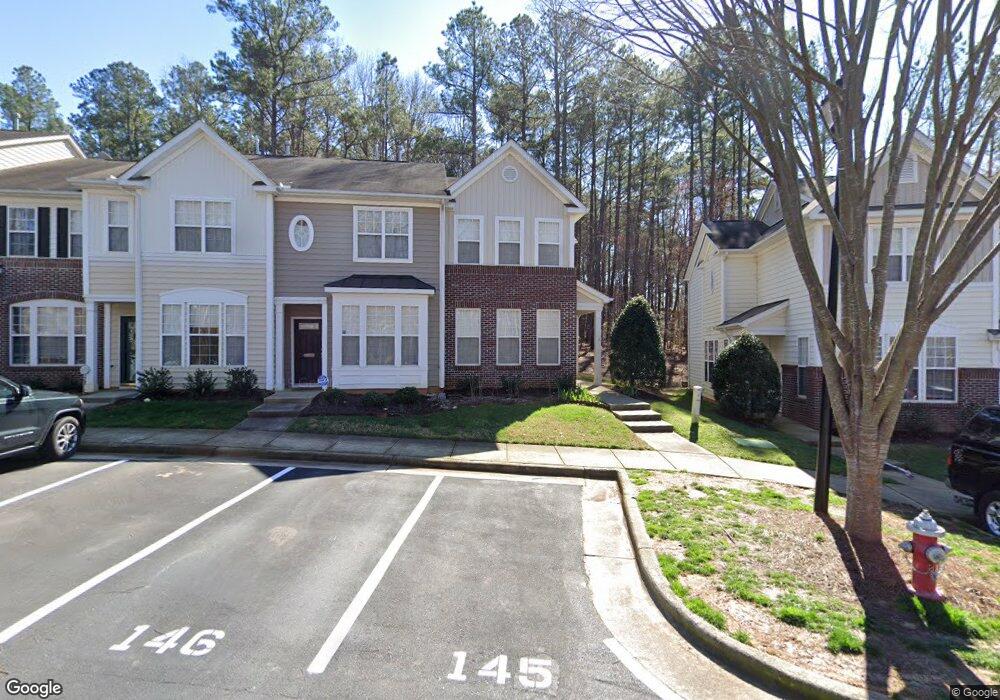
4327 Sugarbend Way Raleigh, NC 27606
South Raleigh NeighborhoodEstimated Value: $312,000 - $321,000
2
Beds
3
Baths
1,325
Sq Ft
$239/Sq Ft
Est. Value
About This Home
This home is located at 4327 Sugarbend Way, Raleigh, NC 27606 and is currently estimated at $317,209, approximately $239 per square foot. 4327 Sugarbend Way is a home located in Wake County with nearby schools including Dillard Drive Magnet Elementary School, Dillard Drive Magnet Middle School, and Adventist Christian Academy of Raleigh.
Ownership History
Date
Name
Owned For
Owner Type
Purchase Details
Closed on
Jun 22, 2015
Sold by
Haurlick Tammy L
Bought by
Thigpen Steven M
Current Estimated Value
Home Financials for this Owner
Home Financials are based on the most recent Mortgage that was taken out on this home.
Original Mortgage
$128,350
Outstanding Balance
$100,010
Interest Rate
3.92%
Mortgage Type
New Conventional
Estimated Equity
$217,199
Purchase Details
Closed on
Jul 15, 2009
Sold by
Cloninger Larry and Cloninger Susan
Bought by
Haurilick Tammy L
Home Financials for this Owner
Home Financials are based on the most recent Mortgage that was taken out on this home.
Original Mortgage
$100,000
Interest Rate
5.27%
Mortgage Type
New Conventional
Purchase Details
Closed on
May 5, 2006
Sold by
Pilcher Jennifer Gallo and Pilcher Thomas Glenn
Bought by
Cloninger Larry and Cloninger Susan
Purchase Details
Closed on
Jan 26, 2005
Sold by
Westfield Homes Of The Carolinas Llc
Bought by
Gallo Jennifer
Home Financials for this Owner
Home Financials are based on the most recent Mortgage that was taken out on this home.
Original Mortgage
$25,430
Interest Rate
5.62%
Mortgage Type
Credit Line Revolving
Create a Home Valuation Report for This Property
The Home Valuation Report is an in-depth analysis detailing your home's value as well as a comparison with similar homes in the area
Home Values in the Area
Average Home Value in this Area
Purchase History
| Date | Buyer | Sale Price | Title Company |
|---|---|---|---|
| Thigpen Steven M | $162,000 | Attorney | |
| Haurilick Tammy L | $150,000 | None Available | |
| Cloninger Larry | $146,000 | None Available | |
| Gallo Jennifer | $128,000 | -- |
Source: Public Records
Mortgage History
| Date | Status | Borrower | Loan Amount |
|---|---|---|---|
| Open | Thigpen Steven M | $128,350 | |
| Previous Owner | Haurilick Tammy L | $100,000 | |
| Previous Owner | Gallo Jennifer | $25,430 |
Source: Public Records
Tax History Compared to Growth
Tax History
| Year | Tax Paid | Tax Assessment Tax Assessment Total Assessment is a certain percentage of the fair market value that is determined by local assessors to be the total taxable value of land and additions on the property. | Land | Improvement |
|---|---|---|---|---|
| 2025 | $2,638 | $300,211 | $90,000 | $210,211 |
| 2024 | $2,627 | $300,211 | $90,000 | $210,211 |
| 2023 | $2,221 | $201,949 | $45,000 | $156,949 |
| 2022 | $2,065 | $201,949 | $45,000 | $156,949 |
| 2021 | $1,985 | $201,949 | $45,000 | $156,949 |
| 2020 | $1,949 | $201,949 | $45,000 | $156,949 |
| 2019 | $1,733 | $147,797 | $32,000 | $115,797 |
| 2018 | $1,635 | $147,797 | $32,000 | $115,797 |
| 2017 | $1,558 | $147,797 | $32,000 | $115,797 |
| 2016 | $1,526 | $147,797 | $32,000 | $115,797 |
| 2015 | $1,661 | $158,496 | $36,800 | $121,696 |
| 2014 | $1,576 | $158,496 | $36,800 | $121,696 |
Source: Public Records
Map
Nearby Homes
- 5229 Moonview Ct
- 4510 Sugarbend Way
- 4536 Sugarbend Way
- 5318 Crescentview Pkwy
- 5407 Crescentview Pkwy
- 4017 Tryon Rd
- 4511 Pale Moss Dr
- 4513 Pale Moss Dr
- 3977 Amelia Park Dr
- 4538 Pale Moss Dr
- 4421 Bridle Run Dr
- 5569 Sea Daisy Dr
- 5322 Goldenglow Way
- 4640 Asterwood Dr
- 5333 Olive Rd
- 5228 Olive Rd
- 3770 Pardue Woods Place Unit 201
- 1929 Fieldhouse Ave
- 2011 Wolfmill Dr Unit 301
- 2120 Wolftech Ln Unit 304
- 4325 Sugarbend Way
- 4331 Sugarbend Way
- 4323 Sugarbend Way
- 4321 Sugarbend Way
- 4333 Sugarbend Way
- 4319 Sugarbend Way
- 4335 Sugarbend Way
- 4317 Sugarbend Way
- 4337 Sugarbend Way
- 4315 Sugarbend Way
- 4339 Sugarbend Way
- 4341 Sugarbend Way
- 4343 Sugarbend Way
- 4227 Sugarbend Way
- 4311 Sugarbend Way
- 4309 Sugarbend Way
- 4307 Sugarbend Way
- 4351 Sugarbend Way
- 4305 Sugarbend Way
- 4324 Tryon Rd