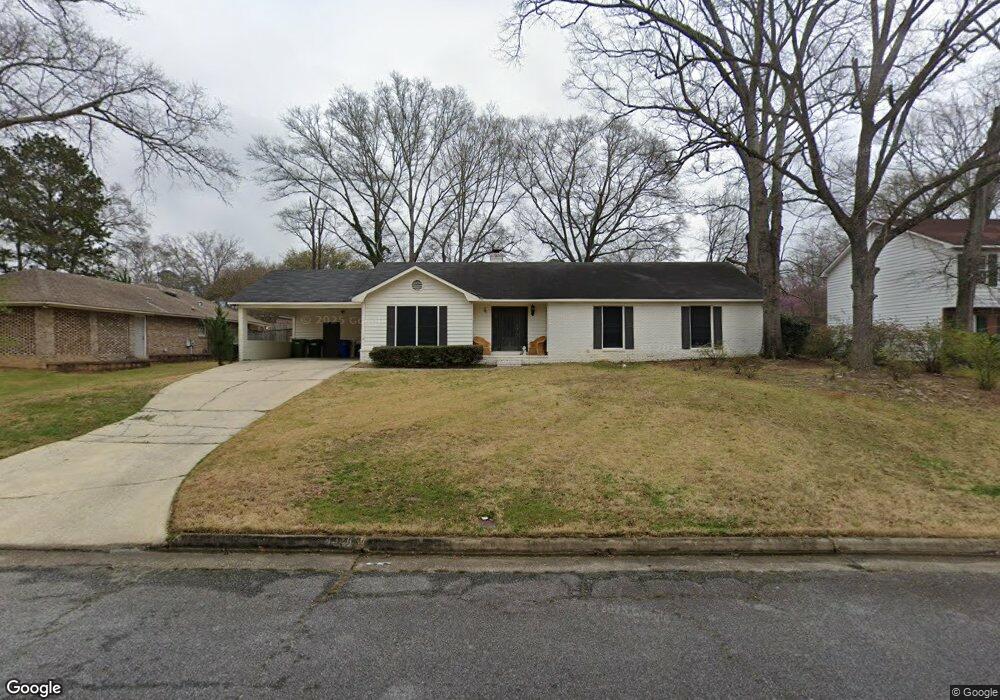
4328 Castlewood Ct Columbus, GA 31907
Eastern Columbus NeighborhoodEstimated Value: $217,000 - $284,000
3
Beds
3
Baths
1,737
Sq Ft
$136/Sq Ft
Est. Value
About This Home
This home is located at 4328 Castlewood Ct, Columbus, GA 31907 and is currently estimated at $236,986, approximately $136 per square foot. 4328 Castlewood Ct is a home located in Muscogee County with nearby schools including Reese Road Leadership Academy, Fort Middle School, and Hardaway High School.
Ownership History
Date
Name
Owned For
Owner Type
Purchase Details
Closed on
Mar 27, 2018
Sold by
323 Properties Llc
Bought by
Fomby Shane D and Mitchell Fomby Brittany N
Current Estimated Value
Home Financials for this Owner
Home Financials are based on the most recent Mortgage that was taken out on this home.
Original Mortgage
$168,547
Outstanding Balance
$144,914
Interest Rate
4.43%
Mortgage Type
VA
Estimated Equity
$92,072
Purchase Details
Closed on
Jun 28, 2017
Sold by
Trice Jeffrey A
Bought by
323 Properties Llc
Purchase Details
Closed on
Sep 6, 2012
Sold by
Trice Amanda G
Bought by
Trice Jeffrey A
Purchase Details
Closed on
Mar 25, 2011
Sold by
Trice Jeffrey A
Bought by
Trice Jeffrey A and Trice Amanda G
Home Financials for this Owner
Home Financials are based on the most recent Mortgage that was taken out on this home.
Original Mortgage
$90,000
Interest Rate
4.75%
Mortgage Type
FHA
Create a Home Valuation Report for This Property
The Home Valuation Report is an in-depth analysis detailing your home's value as well as a comparison with similar homes in the area
Home Values in the Area
Average Home Value in this Area
Purchase History
| Date | Buyer | Sale Price | Title Company |
|---|---|---|---|
| Fomby Shane D | $165,000 | -- | |
| 323 Properties Llc | $90,000 | -- | |
| Trice Jeffrey A | -- | -- | |
| Trice Jeffrey A | -- | None Available | |
| Trice Jeffrey A | $165,000 | None Available | |
| Trice Jeffrey A | -- | -- | |
| Trice Jeffrey A | $165,000 | -- |
Source: Public Records
Mortgage History
| Date | Status | Borrower | Loan Amount |
|---|---|---|---|
| Open | Fomby Shane D | $168,547 | |
| Previous Owner | Trice Jeffrey A | $90,000 |
Source: Public Records
Tax History Compared to Growth
Tax History
| Year | Tax Paid | Tax Assessment Tax Assessment Total Assessment is a certain percentage of the fair market value that is determined by local assessors to be the total taxable value of land and additions on the property. | Land | Improvement |
|---|---|---|---|---|
| 2025 | $2,666 | $68,100 | $9,284 | $58,816 |
| 2024 | $2,666 | $68,100 | $9,284 | $58,816 |
| 2023 | $2,683 | $68,100 | $9,284 | $58,816 |
| 2022 | $2,401 | $58,808 | $9,284 | $49,524 |
| 2021 | $2,231 | $54,636 | $9,284 | $45,352 |
| 2020 | $2,231 | $54,636 | $9,284 | $45,352 |
| 2019 | $2,239 | $54,636 | $9,284 | $45,352 |
| 2018 | $1,475 | $36,000 | $6,280 | $29,720 |
| 2017 | $2,434 | $52,940 | $9,284 | $43,656 |
| 2016 | $2,175 | $66,000 | $7,136 | $58,864 |
| 2015 | $2,178 | $66,000 | $7,136 | $58,864 |
| 2014 | $2,181 | $66,000 | $7,136 | $58,864 |
| 2013 | -- | $66,000 | $7,136 | $58,864 |
Source: Public Records
Map
Nearby Homes
- 10 Conisburgh Ct
- 4524 Hedingham Ln
- 4017 River Rock Way
- 4110 Norwood Dr
- 4807 Fairview Dr
- 4520 Marci Ct
- 4004 Tifton Dr
- 4120 Fairview Dr
- 3935 Tifton Dr
- 2 Hidden Woods Ct
- 4813 Rowland Ct
- 4832 Rowland Ave
- 4635 Delfair Dr
- 4565 Prim Dr
- 3053 Reese Rd
- 3816 Anglin Rd
- 4419 Anglin Rd
- 4123 Warm Springs Rd
- 4975 Glacier Dr
- 3872 E Britt David Rd
- 4334 Castlewood Ct
- 4318 Castlewood Ct
- 4319 Castlewood Pkwy
- 4311 Castlewood Pkwy
- 4331 Castlewood Ct
- 4333 Castlewood Pkwy
- 4323 Castlewood Ct
- 4303 Castlewood Pkwy
- 4342 Castlewood Ct
- 4339 Castlewood Ct
- 0 Mereworth Ct
- 4401 Castlewood Pkwy
- 4349 Castlewood Ct
- 4320 Castlewood Pkwy
- 4400 Mereworth Ct
- 4343 Castlewood Ct
- 4309 Castlewood Ct
- 4310 Castlewood Pkwy
- 4232 King Arthur Place
- 4301 Castlewood Ct