4328 E 53rd St Maywood, CA 90270
Estimated Value: $687,000 - $703,000
About This Home
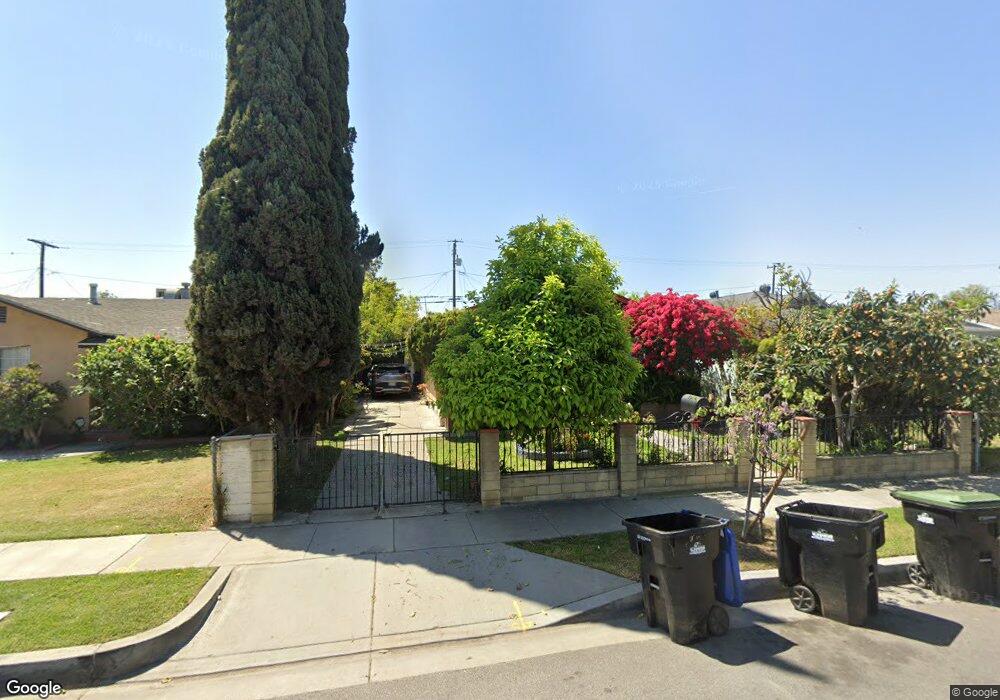
This home is located at 4328 E 53rd St, Maywood, CA 90270 and is currently estimated at $693,534, approximately $530 per square foot. 4328 E 53rd St is a home located in Los Angeles County with nearby schools including Maywood Elementary School, Chester W. Nimitz Middle School, and Maywood Academy High School.
Ownership History
We collect this data history from publicly available records. To have your information removed, we recommend requesting removal directly through your county’s website.
Purchase Details
Purchase Details
Home Financials for this Owner
Home Financials are based on the most recent Mortgage that was taken out on this home.Purchase Details
Home Financials for this Owner
Home Financials are based on the most recent Mortgage that was taken out on this home.Home Values in the Area
Average Home Value in this Area
Purchase History
We collect this data history from publicly available records. To have your information removed, we recommend requesting removal directly through your county’s website.
| Date | Buyer | Sale Price | Title Company |
|---|---|---|---|
| -- | None Listed On Document | ||
| -- | Investors Title Company | ||
| $160,000 | First American |
Mortgage History
We collect this data history from publicly available records. To have your information removed, we recommend requesting removal directly through your county’s website.
| Date | Status | Borrower | Loan Amount |
|---|---|---|---|
| Previous Owner | $149,500 | ||
| Previous Owner | $143,840 |
Tax History
We collect this data history from publicly available records. To have your information removed, we recommend requesting removal directly through your county’s website.
| Year | Tax Paid | Tax Assessment Tax Assessment Total Assessment is a certain percentage of the fair market value that is determined by local assessors to be the total taxable value of land and additions on the property. | Land | Improvement |
|---|---|---|---|---|
| 2025 | $4,121 | $265,769 | $164,119 | $101,650 |
| 2024 | $3,999 | $260,558 | $160,901 | $99,657 |
| 2023 | $3,932 | $255,450 | $157,747 | $97,703 |
| 2022 | $3,770 | $250,442 | $154,654 | $95,788 |
| 2021 | $3,721 | $245,532 | $151,622 | $93,910 |
| 2019 | $3,608 | $238,252 | $147,126 | $91,126 |
| 2018 | $3,494 | $233,582 | $144,242 | $89,340 |
| 2016 | $3,275 | $224,514 | $138,642 | $85,872 |
| 2015 | $3,090 | $221,143 | $136,560 | $84,583 |
| 2014 | $3,090 | $216,812 | $133,885 | $82,927 |
Map
- 4439 E 52nd Place
- 4361 E 56th St
- 4056 E 55th St
- 4535 E 55th St
- 0 0 Fir Unit 202604501
- 3913 E 55th St
- 4301 E 60th St
- 5954 Riverside Ave
- 3725 E 57th St
- 3700 E 55th St
- 3651 E 56th St
- 6048 King Ave
- 5117 Everett Ave
- 5716 Maywood Ave
- 3519 E 60th St
- 4957 E 59th Place
- 3531 E 61st St
- 6221 Heliotrope Ave
- 4026 Gage Ave
- 6509 Prospect Ave
Ask me questions while you tour the home.