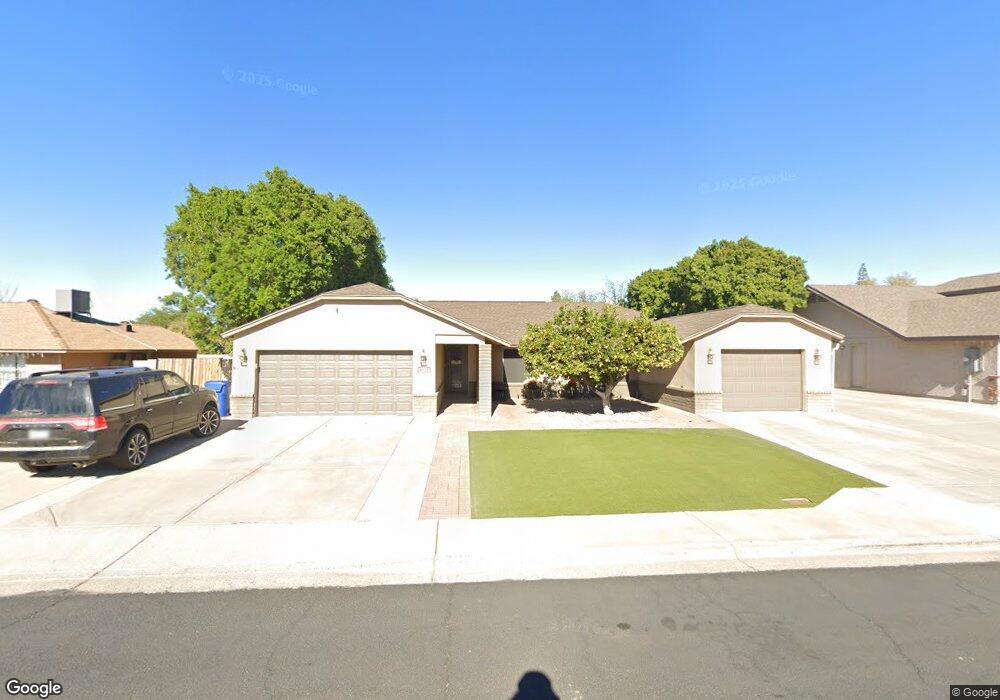
4328 E Dover St Mesa, AZ 85205
The Groves NeighborhoodEstimated Value: $462,190 - $585,000
Studio
4
Baths
2,272
Sq Ft
$230/Sq Ft
Est. Value
About This Home
This home is located at 4328 E Dover St, Mesa, AZ 85205 and is currently estimated at $521,548, approximately $229 per square foot. 4328 E Dover St is a home located in Maricopa County with nearby schools including Entz Elementary School, Franklin at Brimhall Elementary School, and Franklin West Elementary School.
Ownership History
Date
Name
Owned For
Owner Type
Purchase Details
Closed on
Sep 25, 2020
Sold by
Stevenson Tommy J and Stevenson Cynthia R
Bought by
Stevenson Family Living Trust and Stevenson
Current Estimated Value
Home Financials for this Owner
Home Financials are based on the most recent Mortgage that was taken out on this home.
Original Mortgage
$160,000
Outstanding Balance
$86,912
Interest Rate
2.8%
Mortgage Type
New Conventional
Estimated Equity
$434,636
Purchase Details
Closed on
Jun 30, 2011
Sold by
Stevenson Tommy J and Stevenson Cynthia R
Bought by
Stevenson Tommy J and Stevenson Cynthia R
Purchase Details
Closed on
Jul 14, 2003
Sold by
Stevenson T J and Stevenson Cindi R
Bought by
Stevenson Tommy J and Stevenson Cynthia R
Create a Home Valuation Report for This Property
The Home Valuation Report is an in-depth analysis detailing your home's value as well as a comparison with similar homes in the area
Home Values in the Area
Average Home Value in this Area
Purchase History
| Date | Buyer | Sale Price | Title Company |
|---|---|---|---|
| Stevenson Family Living Trust | -- | Accommodation | |
| Stevenson Tommy J | -- | Chicago Title Agency Inc | |
| Stevenson Tommy J | -- | None Available | |
| Stevenson Tommy J | -- | None Available | |
| Stevenson Tommy J | -- | -- |
Source: Public Records
Mortgage History
| Date | Status | Borrower | Loan Amount |
|---|---|---|---|
| Open | Stevenson Tommy J | $160,000 |
Source: Public Records
Tax History
| Year | Tax Paid | Tax Assessment Tax Assessment Total Assessment is a certain percentage of the fair market value that is determined by local assessors to be the total taxable value of land and additions on the property. | Land | Improvement |
|---|---|---|---|---|
| 2025 | $2,025 | $23,856 | -- | -- |
| 2024 | $2,047 | $22,720 | -- | -- |
| 2023 | $2,047 | $37,370 | $7,470 | $29,900 |
| 2022 | $2,003 | $29,020 | $5,800 | $23,220 |
| 2021 | $2,049 | $28,230 | $5,640 | $22,590 |
| 2020 | $2,021 | $27,070 | $5,410 | $21,660 |
| 2019 | $1,875 | $25,020 | $5,000 | $20,020 |
| 2018 | $1,788 | $23,320 | $4,660 | $18,660 |
| 2017 | $1,733 | $21,460 | $4,290 | $17,170 |
| 2016 | $1,693 | $21,370 | $4,270 | $17,100 |
| 2015 | $1,604 | $20,410 | $4,080 | $16,330 |
Source: Public Records
Map
Nearby Homes
- 4429 E Downing Cir
- 4530 E Decatur St
- 4556 E Downing St
- 4449 E Elmwood St
- 4650 E Decatur St
- 4065 E University Dr Unit 157
- 4562 E Elmwood St
- 4245 E Fountain St
- 4335 E Fox Cir
- 3920 E Ellis St
- 4749 E Contessa St
- 625 N 38th St
- 4326 E Fairbrook Cir
- 4065 E University Dr Unit 433
- 4065 E University Dr Unit 50
- 4065 E University Dr Unit 430
- 4065 E University Dr Unit 136
- 4065 E University Dr Unit 516
- 4065 E University Dr Unit 456
- 4065 E University Dr Unit 344
- 4316 E Dover St
- 4336 E Dover St Unit 1
- 4327 E Des Moines St
- 4341 E Des Moines St
- 4319 E Des Moines St
- 4304 E Dover St
- 4348 E Dover St
- 4329 E Dover St
- 4317 E Dover St
- 4337 E Dover St
- 4345 E Des Moines St
- 4307 E Des Moines St
- 4307 E Des Moines St Unit 1
- 4305 E Dover St
- 4349 E Dover St
- 4356 E Dover St
- 4256 E Dover St
- 4353 E Des Moines St
- 4265 E Des Moines St
- 4322 E Decatur St Unit I
Your Personal Tour Guide
Ask me questions while you tour the home.