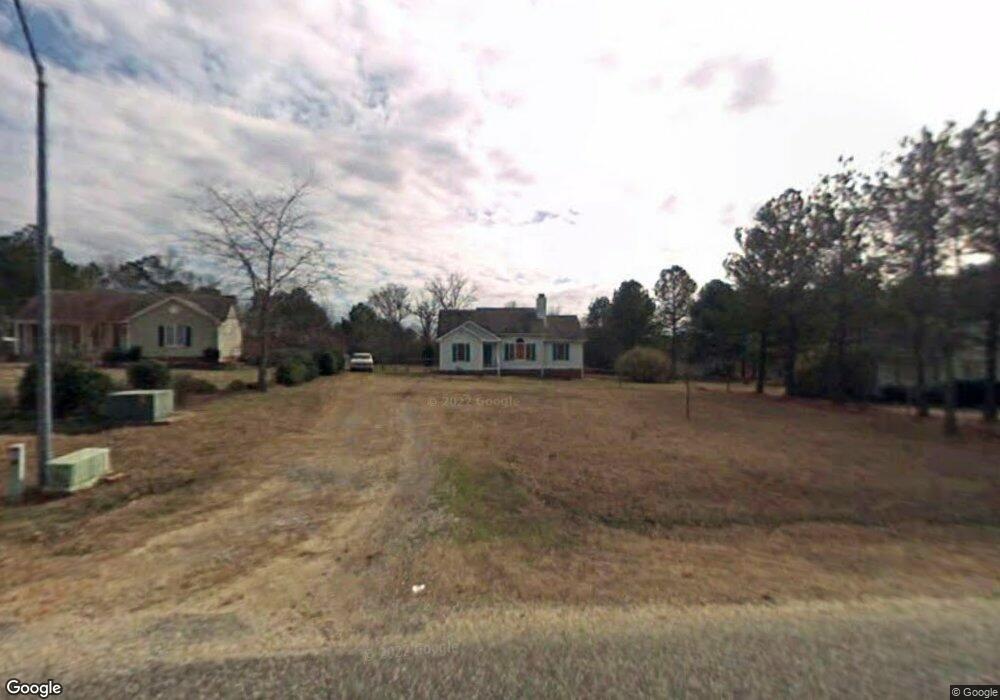
4328 Rockside Hills Dr Raleigh, NC 27603
Estimated Value: $318,000 - $335,699
3
Beds
2
Baths
1,400
Sq Ft
$231/Sq Ft
Est. Value
About This Home
This home is located at 4328 Rockside Hills Dr, Raleigh, NC 27603 and is currently estimated at $323,175, approximately $230 per square foot. 4328 Rockside Hills Dr is a home located in Wake County with nearby schools including North Garner Middle and Garner High.
Ownership History
Date
Name
Owned For
Owner Type
Purchase Details
Closed on
Oct 31, 2019
Sold by
Southern Built Llc
Bought by
Luna Jonathan A Ruiceco and Luna Jonathan Antonio Ruiceco
Current Estimated Value
Home Financials for this Owner
Home Financials are based on the most recent Mortgage that was taken out on this home.
Original Mortgage
$192,060
Outstanding Balance
$168,625
Interest Rate
3.5%
Mortgage Type
New Conventional
Estimated Equity
$154,550
Purchase Details
Closed on
Jul 24, 2019
Sold by
Bradford William Joseph and Bradford Deanna T
Bought by
Southern Built Llc
Purchase Details
Closed on
Jul 29, 2002
Sold by
Waller Mary L
Bought by
Bradford William Joseph
Home Financials for this Owner
Home Financials are based on the most recent Mortgage that was taken out on this home.
Original Mortgage
$108,300
Interest Rate
6.67%
Create a Home Valuation Report for This Property
The Home Valuation Report is an in-depth analysis detailing your home's value as well as a comparison with similar homes in the area
Home Values in the Area
Average Home Value in this Area
Purchase History
| Date | Buyer | Sale Price | Title Company |
|---|---|---|---|
| Luna Jonathan A Ruiceco | $200,000 | None Available | |
| Luna Jonathan A Ruiceco | $200,000 | None Listed On Document | |
| Southern Built Llc | $140,000 | None Available | |
| Bradford William Joseph | $110,000 | -- |
Source: Public Records
Mortgage History
| Date | Status | Borrower | Loan Amount |
|---|---|---|---|
| Open | Luna Jonathan A Ruiceco | $192,060 | |
| Closed | Luna Jonathan A Ruiceco | $192,060 | |
| Previous Owner | Bradford William Joseph | $108,300 |
Source: Public Records
Tax History Compared to Growth
Tax History
| Year | Tax Paid | Tax Assessment Tax Assessment Total Assessment is a certain percentage of the fair market value that is determined by local assessors to be the total taxable value of land and additions on the property. | Land | Improvement |
|---|---|---|---|---|
| 2025 | $1,952 | $302,053 | $125,000 | $177,053 |
| 2024 | $1,896 | $302,053 | $125,000 | $177,053 |
| 2023 | $1,470 | $186,015 | $40,000 | $146,015 |
| 2022 | $1,363 | $186,015 | $40,000 | $146,015 |
| 2021 | $1,327 | $186,015 | $40,000 | $146,015 |
| 2020 | $1,305 | $186,015 | $40,000 | $146,015 |
| 2019 | $1,056 | $126,804 | $26,000 | $100,804 |
| 2018 | $972 | $126,804 | $26,000 | $100,804 |
| 2017 | $922 | $126,804 | $26,000 | $100,804 |
| 2016 | $903 | $126,804 | $26,000 | $100,804 |
| 2015 | $958 | $135,085 | $28,000 | $107,085 |
| 2014 | -- | $135,085 | $28,000 | $107,085 |
Source: Public Records
Map
Nearby Homes
- 6908 Longridge Dr
- 7508 Frasier Fir Place
- 221 Old Hickory Dr
- 272 Travel Lite Dr
- 149 Steep Rock Dr
- 618 Durwood Dr
- 595 Durwood Dr
- 158 Linville Ln
- 401 Blackberry Creek Dr
- 105 Huckleberry Ct
- 212 Fox Pen Dr
- 29 Linville Ln
- 408 Johnston Rd
- 895 November Ln
- 170 Sallyport Ct
- 834 November Ln
- 6408 Glen Brack Ct
- 6313 Southern Charm Ln
- 1021 Forest Glen Dr
- 96 Jackson Ridge Ct
- 4332 Rockside Hills Dr
- 4324 Rockside Hills Dr
- 4336 Rockside Hills Dr
- 4336 Rockside Hills Dr
- 4336 Rockside Hills Dr
- 4336 Rockside Hills Dr
- 4320 Rockside Hills Dr
- 4333 Rockside Hills Dr
- 4333 Rockside Hills Dr
- 4321 Rockside Hills Dr
- 7212 Jeff Dr
- 4340 Rockside Hills Dr
- 4316 Rockside Hills Dr
- 4317 Rockside Hills Dr
- 4344 Rockside Hills Dr
- 4313 Rockside Hills Dr
- 5005 Jackson King Rd
- 4312 Rockside Hills Dr
- 4309 Rockside Hills Dr
- 1013 Toy Ct