NOT LISTED FOR SALE

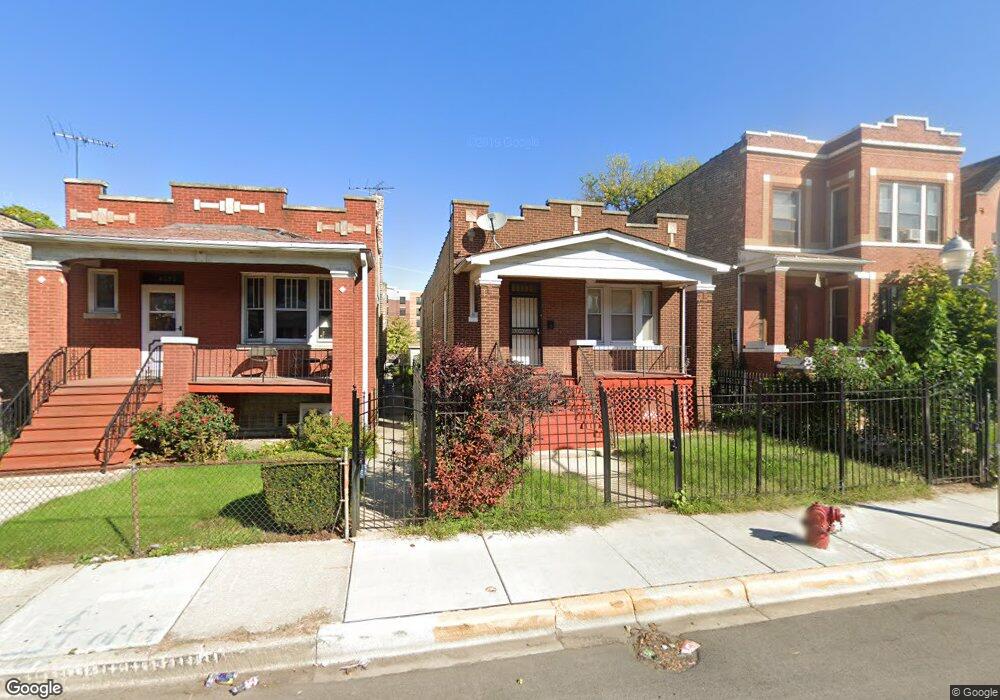
Estimated Value: $196,000 - $250,000

3 Beds
1 Bath
1,104 Sq Ft
$206/Sq Ft Est. Value

Last Sold October 20, 2021

Last sale price $185,500 $168 Per Sq Ft

Est. 23% increase in value since last sale

Current estimated payment $1,308/month

About This Home

As of October 2021

This home is located at 4328 W Cullerton St, Chicago, IL 60623 and is currently estimated at $227,253, approximately $205 per square foot. 4328 W Cullerton St is a home located in Cook County with nearby schools including Mason Elementary School and Epiphany Catholic School.

Ownership History

Date Name Owned For Owner Type

Purchase Details

Listed on
Sep 1, 2021
Closed on
Oct 20, 2021
Sold by
Bryant James
Bought by
Patterson Tracy
Seller's Agent
Darvyaire Turner
eXp Realty
Buyer's Agent
Kotera Heard
eXp Realty
List Price
$176,333
Sold Price
$185,500
Premium/Discount to List
$9,167
5.2%
Current Estimated Value
$227,253

Home Financials for this Owner

Home Financials are based on the most recent Mortgage that was taken out on this home.
Estimated Appreciation
$41,753
Avg. Annual Appreciation
5.19%
Original Mortgage
$182,139
Outstanding Balance
$168,533
Interest Rate
3.87%
Mortgage Type
FHA
Estimated Equity
$58,720

Purchase Details

Closed on
Aug 2, 2006
Sold by
Long Charles H and Lee June C
Bought by
Bryant James
Source: Public Records

Range of Values:

Collateral Analytics

Collateral Analytics Collateral Analytics AVMs (Automated Valuation Model) employ a number of statistical approaches combined with neighborhood-specific comparable selection guarantees the most up-to-date and precise valuations.

Not Available

Collateral Analytics does not have data for the current month. Please view the chart for historical values.

ICE

ICE Mortgage Technology ICE Mortgage Technology’s AVM (Automated Valuation Model) is a state-of-the-art online residential property valuation tool that provides a quick and accurate estimate of the value of almost any home in the U.S.

Not Available

ICE Mortgage Technology does not have data for the current month. Please view the chart for historical values.

First American

First American First American Data & Analytics’ next-generation AVM combines unrivaled data assets with a blended ensemble of valuation models to produce highly accurate, reliable valuations you can trust.

Not Available

First American does not have data for the current month. Please view the chart for historical values.

Quantarium

Quantarium Quantarium’s valuation service, repeatedly proven the industry’s most accurate and comprehensive, is supercharged with a self-learning and auto-tuning AI engine that continually becomes smarter and more accurate as it processes daily inputs from the industry’s leading RE data lake.

Not Available

Quantarium does not have data for the current month. Please view the chart for historical values.

Average Value
Not Available
List Price
Sold Price
Create a Home Valuation Report for This Property
The Home Valuation Report is an in-depth analysis detailing your home's value as well as a comparison with similar homes in the area

Home Values in the Area

Source: Public Records

Average Home Value in this Area


Source: Public Records

Purchase History

Date Buyer Sale Price Title Company
Patterson Tracy $185,500 Attorney
Bryant James $130,000 First American Title Ins Co
Source: Public Records

Mortgage History

Date Status Borrower Loan Amount
Open Patterson Tracy $182,139
Source: Public Records

Property History

Date Event Price List to Sale Price per Sq Ft Prior Sale
10/20/2021 10/20/21 Sold $185,500 +5.2% $168 / Sq Ft View Prior Sale
09/04/2021 09/04/21 Pending -- -- --
09/01/2021 09/01/21 For Sale $176,333 -- $160 / Sq Ft

Tax History Compared to Growth

Source: Public Records

Tax History

Year Tax Paid Tax Assessment Tax Assessment Total Assessment is a certain percentage of the fair market value that is determined by local assessors to be the total taxable value of land and additions on the property. Land Improvement
2024 $1,270 $12,801 $5,438 $7,363
2023 $1,238 $6,000 $3,170 $2,830
2022 $1,238 $6,000 $3,170 $2,830
2021 $1,210 $5,998 $3,168 $2,830
2020 $1,885 $8,432 $4,406 $4,026
2019 $1,889 $9,369 $4,406 $4,963
2018 $1,857 $9,369 $4,406 $4,963
2017 $2,241 $10,376 $3,937 $6,439
2016 $2,078 $10,376 $3,937 $6,439
2015 $1,901 $10,376 $3,937 $6,439
2014 $1,896 $10,221 $3,750 $6,471
2013 $1,859 $10,221 $3,750 $6,471
Source: Public Records

Agents Affiliated with this Home

  • Section Image
  • Section Image
See All Agents

Map