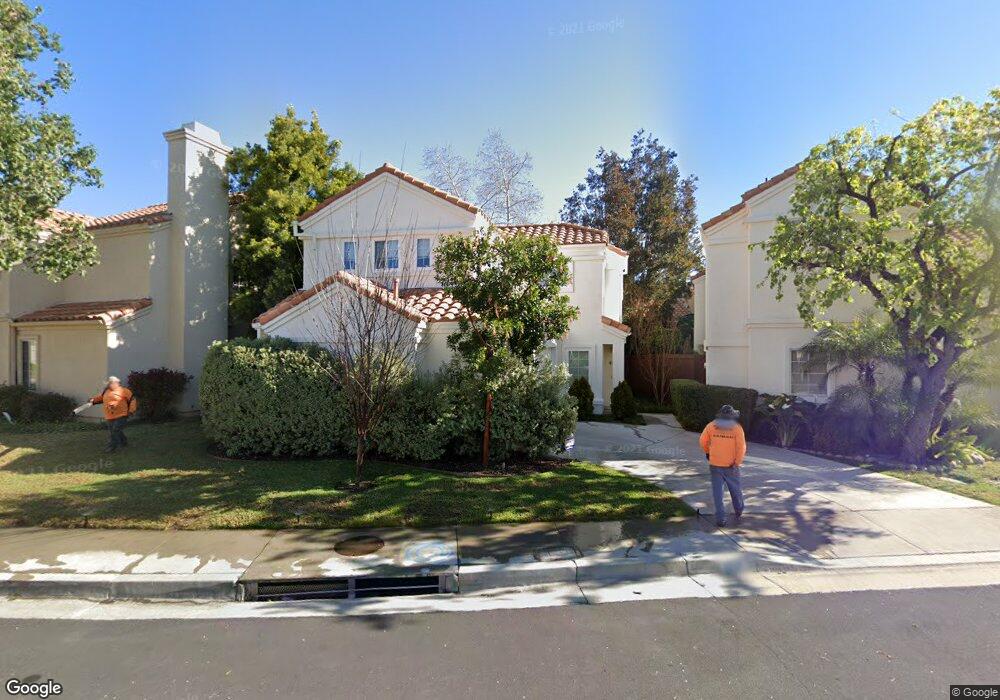
4328 Willow Glen St Calabasas, CA 91302
Estimated Value: $1,040,667 - $1,258,000
3
Beds
3
Baths
1,675
Sq Ft
$684/Sq Ft
Est. Value
About This Home
This home is located at 4328 Willow Glen St, Calabasas, CA 91302 and is currently estimated at $1,144,917, approximately $683 per square foot. 4328 Willow Glen St is a home located in Los Angeles County with nearby schools including Lupin Hill Elementary, Arthur E. Wright Middle School, and Calabasas High School.
Ownership History
Date
Name
Owned For
Owner Type
Purchase Details
Closed on
Aug 14, 2020
Sold by
Dhingra Manu and The Manu Dhingra Living Trust
Bought by
Dhingra Manu and The Manu Dhingra Living Trust
Current Estimated Value
Home Financials for this Owner
Home Financials are based on the most recent Mortgage that was taken out on this home.
Original Mortgage
$470,000
Outstanding Balance
$416,146
Interest Rate
2.9%
Mortgage Type
New Conventional
Estimated Equity
$728,771
Purchase Details
Closed on
Aug 29, 2012
Sold by
Dhingra Manuj
Bought by
Dhingra Manuj and Manuj Dhingra Living Trust
Purchase Details
Closed on
May 25, 2011
Sold by
Bennett Matthew and Kong Susie
Bought by
Dhingra Manuj
Home Financials for this Owner
Home Financials are based on the most recent Mortgage that was taken out on this home.
Original Mortgage
$340,000
Interest Rate
4.63%
Mortgage Type
New Conventional
Create a Home Valuation Report for This Property
The Home Valuation Report is an in-depth analysis detailing your home's value as well as a comparison with similar homes in the area
Home Values in the Area
Average Home Value in this Area
Purchase History
| Date | Buyer | Sale Price | Title Company |
|---|---|---|---|
| Dhingra Manu | -- | Chicago Title | |
| Dhingra Manuj | -- | None Available | |
| Dhingra Manuj | $530,000 | California Title Company |
Source: Public Records
Mortgage History
| Date | Status | Borrower | Loan Amount |
|---|---|---|---|
| Open | Dhingra Manu | $470,000 | |
| Closed | Dhingra Manuj | $340,000 |
Source: Public Records
Tax History Compared to Growth
Tax History
| Year | Tax Paid | Tax Assessment Tax Assessment Total Assessment is a certain percentage of the fair market value that is determined by local assessors to be the total taxable value of land and additions on the property. | Land | Improvement |
|---|---|---|---|---|
| 2025 | $7,820 | $679,010 | $490,428 | $188,582 |
| 2024 | $7,820 | $665,697 | $480,812 | $184,885 |
| 2023 | $7,583 | $652,645 | $471,385 | $181,260 |
| 2022 | $7,351 | $639,849 | $462,143 | $177,706 |
| 2021 | $7,335 | $627,304 | $453,082 | $174,222 |
| 2019 | $7,075 | $608,700 | $439,645 | $169,055 |
| 2018 | $7,021 | $596,766 | $431,025 | $165,741 |
| 2016 | $6,657 | $573,595 | $414,289 | $159,306 |
| 2015 | $6,545 | $564,980 | $408,066 | $156,914 |
| 2014 | $6,456 | $553,914 | $400,073 | $153,841 |
Source: Public Records
Map
Nearby Homes
- 4337 Willow Glen St
- 4275 Las Virgenes Rd Unit 3
- 4201 Las Virgenes Rd Unit 112
- 4201 Las Virgenes Rd Unit 115
- 4240 Lost Hills Rd Unit 3108
- 4240 Lost Hills Rd Unit 3004
- 4240 Lost Hills Rd Unit 1902
- 4240 Lost Hills Rd Unit 1702
- 4591 Camino Del Sol
- 4622 Cielo Cir
- 26823 Hot Springs Place
- 26869 Cold Springs St
- 4229 Via Mira Monte
- 3966 Leighton Point Rd
- 5021 Ambridge Dr
- 5260 Edgeware Dr
- 3661 El Encanto Dr
- 27300 Agoura Rd
- 27311 Country Glen Rd
- 3936 United Rd
- 4324 Willow Glen St
- 4338 Willow Glen St
- 4344 Willow Glen St
- 4325 Oak Glen St
- 4346 Willow Glen St
- 4331 Oak Glen St
- 4327 Willow Glen St
- 4350 Willow Glen St
- 4318 Willow Glen St
- 4323 Willow Glen St
- 4333 Willow Glen St
- 4335 Oak Glen St
- 4321 Willow Glen St
- 4335 Willow Glen St
- 4352 Willow Glen St
- 4316 Willow Glen St
- 4341 Willow Glen St
- 4317 Willow Glen St
- 4339 Willow Glen St
- 4343 Willow Glen St