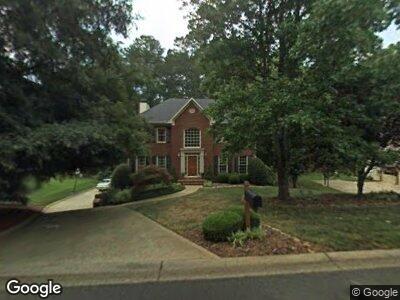
4329 Halifax Terrace NE Unit 2 Roswell, GA 30075
Estimated Value: $722,972 - $787,000
4
Beds
3
Baths
2,884
Sq Ft
$265/Sq Ft
Est. Value
About This Home
This home is located at 4329 Halifax Terrace NE Unit 2, Roswell, GA 30075 and is currently estimated at $764,493, approximately $265 per square foot. 4329 Halifax Terrace NE Unit 2 is a home located in Cobb County with nearby schools including Garrison Mill Elementary School, Mabry Middle School, and Lassiter High School.
Ownership History
Date
Name
Owned For
Owner Type
Purchase Details
Closed on
Dec 27, 2024
Sold by
Hopkins Jerome and Hopkins Diane
Bought by
Jerome Lee Hopkins And Diane Pounders Hopkins and Hopkins
Current Estimated Value
Purchase Details
Closed on
Aug 12, 2003
Sold by
Power Power E and Power Susan
Bought by
Hopkins Jerome and Hopkins Diane
Home Financials for this Owner
Home Financials are based on the most recent Mortgage that was taken out on this home.
Original Mortgage
$263,900
Interest Rate
5.42%
Mortgage Type
New Conventional
Purchase Details
Closed on
May 19, 2000
Sold by
Poteet Danny R and Poteet Yolanda G
Bought by
Power Power E and Power Susan
Home Financials for this Owner
Home Financials are based on the most recent Mortgage that was taken out on this home.
Original Mortgage
$223,200
Interest Rate
8.14%
Mortgage Type
New Conventional
Create a Home Valuation Report for This Property
The Home Valuation Report is an in-depth analysis detailing your home's value as well as a comparison with similar homes in the area
Home Values in the Area
Average Home Value in this Area
Purchase History
| Date | Buyer | Sale Price | Title Company |
|---|---|---|---|
| Jerome Lee Hopkins And Diane Pounders Hopkins | -- | None Listed On Document | |
| Hopkins Jerome | $329,900 | -- | |
| Power Power E | $248,000 | -- |
Source: Public Records
Mortgage History
| Date | Status | Borrower | Loan Amount |
|---|---|---|---|
| Previous Owner | Hopkins Jerome | $169,420 | |
| Previous Owner | Hopkins Jerry L | $85,669 | |
| Previous Owner | Hopkins Jerome | $33,000 | |
| Previous Owner | Hopkins Jerome | $263,900 | |
| Previous Owner | Power E A | $245,000 | |
| Previous Owner | Power Power E | $223,200 |
Source: Public Records
Tax History Compared to Growth
Tax History
| Year | Tax Paid | Tax Assessment Tax Assessment Total Assessment is a certain percentage of the fair market value that is determined by local assessors to be the total taxable value of land and additions on the property. | Land | Improvement |
|---|---|---|---|---|
| 2024 | $1,654 | $244,168 | $52,000 | $192,168 |
| 2023 | $1,448 | $244,168 | $52,000 | $192,168 |
| 2022 | $1,518 | $198,828 | $44,000 | $154,828 |
| 2021 | $1,432 | $169,984 | $44,000 | $125,984 |
| 2020 | $1,432 | $169,984 | $44,000 | $125,984 |
| 2019 | $1,415 | $164,208 | $40,000 | $124,208 |
| 2018 | $1,415 | $164,208 | $40,000 | $124,208 |
| 2017 | $1,194 | $147,504 | $32,000 | $115,504 |
| 2016 | $1,198 | $147,504 | $32,000 | $115,504 |
| 2015 | $1,242 | $135,040 | $42,000 | $93,040 |
| 2014 | $1,270 | $135,040 | $0 | $0 |
Source: Public Records
Map
Nearby Homes
- 4579 Blakedale Cir NE
- 4246 Loch Highland Pkwy NE
- 160 Hialeah Way
- 4242 Loch Highland Pkwy NE
- 3820 Fox Creek Ct
- 4140 Westchester Crossing NE
- 4487 Park Place Terrace
- 4205 Mabry Rd NE
- 4440 Coventry Ct NE
- 4018 Dunbarton Way NE
- 4519 Glenforest Dr NE
- 4865 Surrey Dr Unit 1
- 4673 Jefferson Township Place
- 4943 Keota Run NE
- 4052 Loch Highland Pass NE
- 4700 Township Walk
- 4579 Glenforest Dr NE
- 4927 Bedell Rd NE
- 4329 Halifax Terrace NE Unit 2
- 4327 Halifax Terrace NE
- 4331 Halifax Terrace NE Unit 2
- 4330 Halifax Terrace NE
- 4325 Halifax Terrace NE Unit 2
- 4328 Halifax Terrace NE
- 4334 Halifax Terrace NE
- 4333 Halifax Terrace NE Unit 2
- 4326 Halifax Terrace NE
- 4323 Halifax Terrace NE
- 4336 Halifax Terrace NE
- 4492 Cardiff Ct NE
- 4507 Westcliff Trace NE
- 4507 Westcliff Trace NE Unit TR
- 4490 Cardiff Ct NE
- 4494 Cardiff Ct NE
- 4334 Riverhill Ln NE Unit 8
- 4488 Cardiff Ct NE
- 4332 Riverhill Ln NE Unit 8
- 4338 Halifax Terrace NE