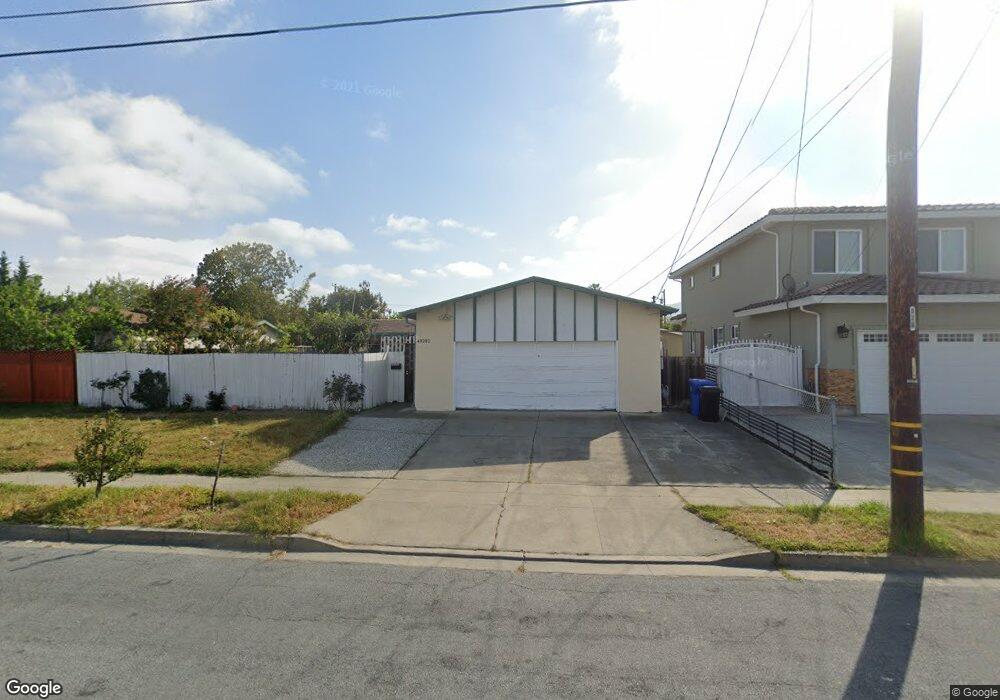
43292 Sweetwood St Fremont, CA 94538
Grimmer NeighborhoodEstimated Value: $959,000 - $1,407,000
3
Beds
2
Baths
1,056
Sq Ft
$1,169/Sq Ft
Est. Value
About This Home
This home is located at 43292 Sweetwood St, Fremont, CA 94538 and is currently estimated at $1,234,762, approximately $1,169 per square foot. 43292 Sweetwood St is a home located in Alameda County with nearby schools including Harvey Green Elementary School, John M. Horner Junior High School, and Irvington High School.
Ownership History
Date
Name
Owned For
Owner Type
Purchase Details
Closed on
Jul 7, 1999
Sold by
Lau Sek K and Ng Yuen M
Bought by
Chu Hong Pei Lin and Chu Xia Xian
Current Estimated Value
Home Financials for this Owner
Home Financials are based on the most recent Mortgage that was taken out on this home.
Original Mortgage
$194,400
Outstanding Balance
$53,078
Interest Rate
7.24%
Estimated Equity
$1,181,684
Purchase Details
Closed on
Jul 20, 1995
Sold by
Lau Sek Keung
Bought by
Lau Sek Keung and Ng Yuen Man
Purchase Details
Closed on
Feb 4, 1994
Sold by
Simerley Nancy Marie and Simerley Tracy R
Bought by
Lau Sek Keung and Tsui Tak K
Home Financials for this Owner
Home Financials are based on the most recent Mortgage that was taken out on this home.
Original Mortgage
$112,500
Interest Rate
7%
Create a Home Valuation Report for This Property
The Home Valuation Report is an in-depth analysis detailing your home's value as well as a comparison with similar homes in the area
Home Values in the Area
Average Home Value in this Area
Purchase History
| Date | Buyer | Sale Price | Title Company |
|---|---|---|---|
| Chu Hong Pei Lin | $243,000 | Old Republic Title Company | |
| Lau Sek Keung | -- | -- | |
| Lau Sek Keung | $150,000 | Premier Title Co |
Source: Public Records
Mortgage History
| Date | Status | Borrower | Loan Amount |
|---|---|---|---|
| Open | Chu Hong Pei Lin | $194,400 | |
| Previous Owner | Lau Sek Keung | $112,500 |
Source: Public Records
Tax History Compared to Growth
Tax History
| Year | Tax Paid | Tax Assessment Tax Assessment Total Assessment is a certain percentage of the fair market value that is determined by local assessors to be the total taxable value of land and additions on the property. | Land | Improvement |
|---|---|---|---|---|
| 2025 | $4,923 | $368,975 | $112,039 | $263,936 |
| 2024 | $4,923 | $361,604 | $109,842 | $258,762 |
| 2023 | $4,778 | $361,378 | $107,689 | $253,689 |
| 2022 | $4,697 | $347,294 | $105,578 | $248,716 |
| 2021 | $4,586 | $340,348 | $103,508 | $243,840 |
| 2020 | $4,539 | $343,788 | $102,447 | $241,341 |
| 2019 | $4,489 | $337,049 | $100,439 | $236,610 |
| 2018 | $4,399 | $330,442 | $98,470 | $231,972 |
| 2017 | $4,288 | $323,964 | $96,540 | $227,424 |
| 2016 | $4,205 | $317,613 | $94,647 | $222,966 |
| 2015 | $4,140 | $312,842 | $93,225 | $219,617 |
| 2014 | $4,062 | $306,714 | $91,399 | $215,315 |
Source: Public Records
Map
Nearby Homes
- 42932 Peachwood St
- 262 Manitoba Green
- 202 Manitoba Terrace
- 261 Manitoba Green Unit 261
- 208 Manitoba Terrace
- 92 Delta Green
- 257 Manitoba Green
- 4309 Bora Ave
- 43163 Grimmer Terrace
- 48 Eagle Green
- 42759 Newport Dr
- 41882 Gifford St
- 4533 Capewood Terrace
- 4537 Capewood Terrace
- 3872 Wildflower Common Unit 27
- 4860 Bryce Canyon Park Dr
- 3631 Haven Ave
- 3918 Fossano Common
- 5341 Audubon Park Ct
- 4751 Wadsworth Ct
- 43280 Sweetwood St
- 43318 Sweetwood St
- 43363 Lindenwood St
- 43251 Lindenwood St
- 43375 Lindenwood St
- 43330 Sweetwood St
- 43268 Sweetwood St
- 43293 Sweetwood St
- 43239 Lindenwood St
- 43281 Sweetwood St
- 43319 Sweetwood St
- 43387 Lindenwood St
- 43269 Sweetwood St
- 43342 Sweetwood St
- 43331 Sweetwood St
- 43257 Sweetwood St
- 43401 Lindenwood St
- 4452 Bush Cir
- 43252 Lindenwood St
- 4454 Bush Cir