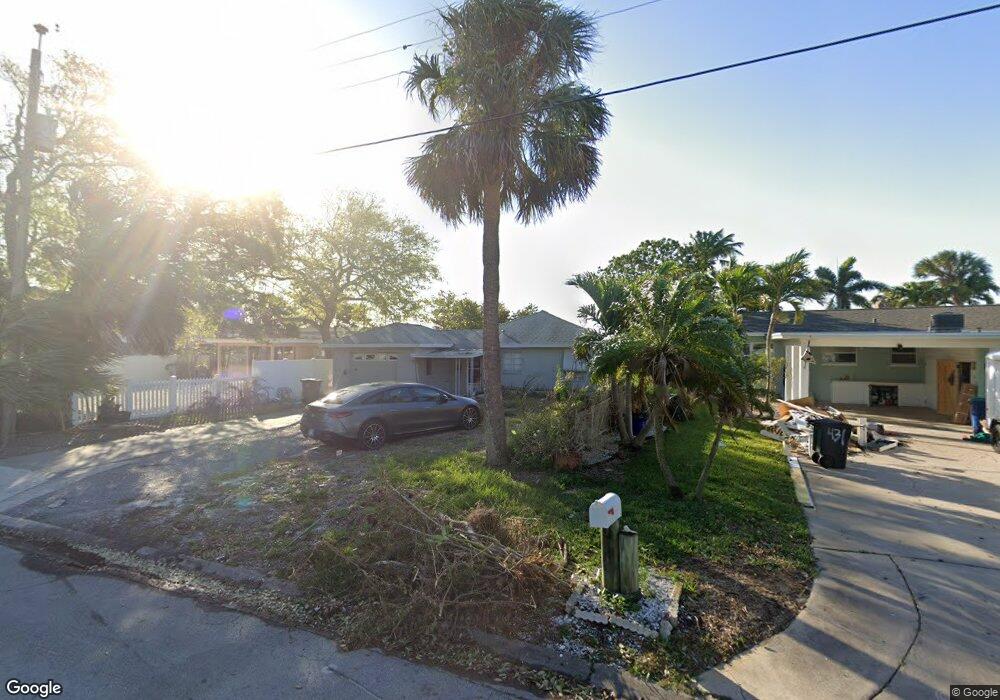
433 18th Ave Indian Rocks Beach, FL 33785
Estimated Value: $643,000 - $930,000
2
Beds
1
Bath
1,494
Sq Ft
$567/Sq Ft
Est. Value
About This Home
This home is located at 433 18th Ave, Indian Rocks Beach, FL 33785 and is currently estimated at $846,564, approximately $566 per square foot. 433 18th Ave is a home located in Pinellas County with nearby schools including Anona Elementary School, Largo High School, and Seminole Middle School.
Ownership History
Date
Name
Owned For
Owner Type
Purchase Details
Closed on
Feb 25, 2022
Sold by
Stephanie Grondin
Bought by
Ainslie Sylvain
Current Estimated Value
Purchase Details
Closed on
Sep 24, 2021
Sold by
Simon Theodore A and Simon Helene C
Bought by
Ainslie Sylvain and Grondin Stephanie
Purchase Details
Closed on
Aug 26, 2015
Sold by
Lacava Julia L
Bought by
Simon Theodore A and Simon Helene C
Home Financials for this Owner
Home Financials are based on the most recent Mortgage that was taken out on this home.
Original Mortgage
$337,250
Interest Rate
4.16%
Mortgage Type
New Conventional
Purchase Details
Closed on
Apr 12, 2002
Sold by
Macpherson Marjorie N
Bought by
Macpherson Marjorie N
Purchase Details
Closed on
Aug 24, 1998
Sold by
Macpherson Robert I
Bought by
Macpherson Marjorie N
Create a Home Valuation Report for This Property
The Home Valuation Report is an in-depth analysis detailing your home's value as well as a comparison with similar homes in the area
Home Values in the Area
Average Home Value in this Area
Purchase History
| Date | Buyer | Sale Price | Title Company |
|---|---|---|---|
| Ainslie Sylvain | -- | Eskanos Danny E | |
| Ainslie Sylvain | $835,000 | Total Title Solutions Llc | |
| Ainslie Sylvain | $835,000 | Total Title Solutions | |
| Simon Theodore A | $375,000 | Title Agency Of Florida Inc | |
| Macpherson Marjorie N | $48,857 | -- | |
| Macpherson Marjorie N | -- | -- |
Source: Public Records
Mortgage History
| Date | Status | Borrower | Loan Amount |
|---|---|---|---|
| Previous Owner | Simon Theodore A | $337,250 |
Source: Public Records
Tax History Compared to Growth
Tax History
| Year | Tax Paid | Tax Assessment Tax Assessment Total Assessment is a certain percentage of the fair market value that is determined by local assessors to be the total taxable value of land and additions on the property. | Land | Improvement |
|---|---|---|---|---|
| 2024 | $15,642 | $1,026,909 | $899,546 | $127,363 |
| 2023 | $15,642 | $1,161,987 | $1,041,581 | $120,406 |
| 2022 | $11,818 | $746,954 | $678,813 | $68,141 |
| 2021 | $5,148 | $335,817 | $0 | $0 |
| 2020 | $5,150 | $331,180 | $0 | $0 |
| 2019 | $5,078 | $323,734 | $0 | $0 |
| 2018 | $4,924 | $317,698 | $0 | $0 |
| 2017 | $4,925 | $311,164 | $0 | $0 |
| 2016 | $4,900 | $304,764 | $0 | $0 |
| 2015 | $4,955 | $299,811 | $0 | $0 |
| 2014 | $4,936 | $297,432 | $0 | $0 |
Source: Public Records
Map
Nearby Homes