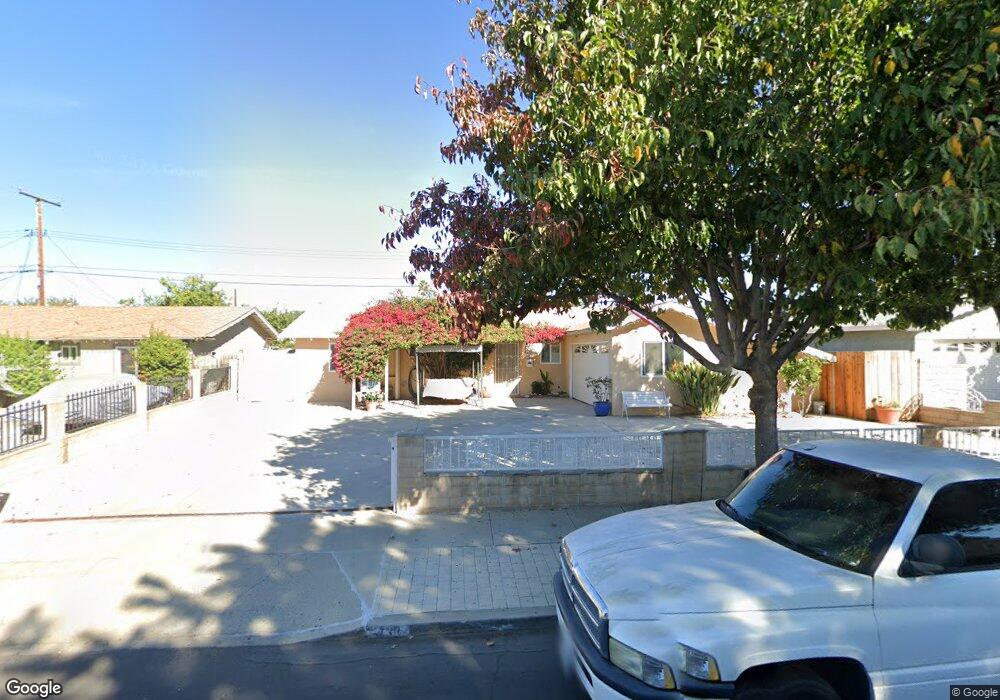
433 2nd St Moorpark, CA 93021
Estimated Value: $615,000 - $689,947
3
Beds
2
Baths
1,068
Sq Ft
$620/Sq Ft
Est. Value
About This Home
This home is located at 433 2nd St, Moorpark, CA 93021 and is currently estimated at $661,987, approximately $619 per square foot. 433 2nd St is a home located in Ventura County with nearby schools including Mountain Meadows Elementary School, Chaparral Middle School, and Moorpark High School.
Ownership History
Date
Name
Owned For
Owner Type
Purchase Details
Closed on
Jul 16, 2008
Sold by
Predmore Cynthia
Bought by
Loza Margarita and Loza Jorgue J
Current Estimated Value
Home Financials for this Owner
Home Financials are based on the most recent Mortgage that was taken out on this home.
Original Mortgage
$12,935
Outstanding Balance
$8,446
Interest Rate
6.31%
Mortgage Type
Seller Take Back
Estimated Equity
$653,541
Create a Home Valuation Report for This Property
The Home Valuation Report is an in-depth analysis detailing your home's value as well as a comparison with similar homes in the area
Home Values in the Area
Average Home Value in this Area
Purchase History
| Date | Buyer | Sale Price | Title Company |
|---|---|---|---|
| Loza Margarita | $13,000 | Fidelity National Title Co |
Source: Public Records
Mortgage History
| Date | Status | Borrower | Loan Amount |
|---|---|---|---|
| Open | Loza Margarita | $12,935 |
Source: Public Records
Tax History
| Year | Tax Paid | Tax Assessment Tax Assessment Total Assessment is a certain percentage of the fair market value that is determined by local assessors to be the total taxable value of land and additions on the property. | Land | Improvement |
|---|---|---|---|---|
| 2025 | $1,326 | $372,792 | $242,093 | $130,699 |
| 2024 | $1,326 | $365,483 | $237,346 | $128,137 |
| 2023 | $1,383 | $358,317 | $232,692 | $125,625 |
| 2022 | $2,267 | $351,292 | $228,130 | $123,162 |
| 2021 | $1,462 | $344,404 | $223,656 | $120,748 |
| 2020 | $3,734 | $340,874 | $221,363 | $119,511 |
| 2019 | $3,650 | $334,191 | $217,023 | $117,168 |
| 2018 | $3,611 | $327,639 | $212,768 | $114,871 |
| 2017 | $3,535 | $321,216 | $208,597 | $112,619 |
| 2016 | $3,467 | $314,918 | $204,507 | $110,411 |
| 2015 | $3,418 | $310,189 | $201,436 | $108,753 |
| 2014 | $3,302 | $302,000 | $197,000 | $105,000 |
Source: Public Records
Map
Nearby Homes
- 445 Millard St
- 516 Spring Rd Unit 113
- 13223 Norfolk Ct
- 1071 Walnut Canyon Rd
- 4520 N Ashtree St
- 13543 Laurelhurst Rd
- 13142 E Mesa Verde Dr
- 4578 Big Country Ct
- 4487 Cedar Branch Ct
- 6625 Pinnacle Way
- 13768 Laurelhurst Rd
- 13191 Honeybee St
- 14207 Clemson St
- 13148 Bent Grass Place
- 13290 Red Bird Ct
- 14819 Blue Ridge Ct
- 6845 Shadow Wood Dr
- 6894 Copper Creek Place
- 6903 Shadow Wood Dr
- 13737 Elkton Ct
Your Personal Tour Guide
Ask me questions while you tour the home.