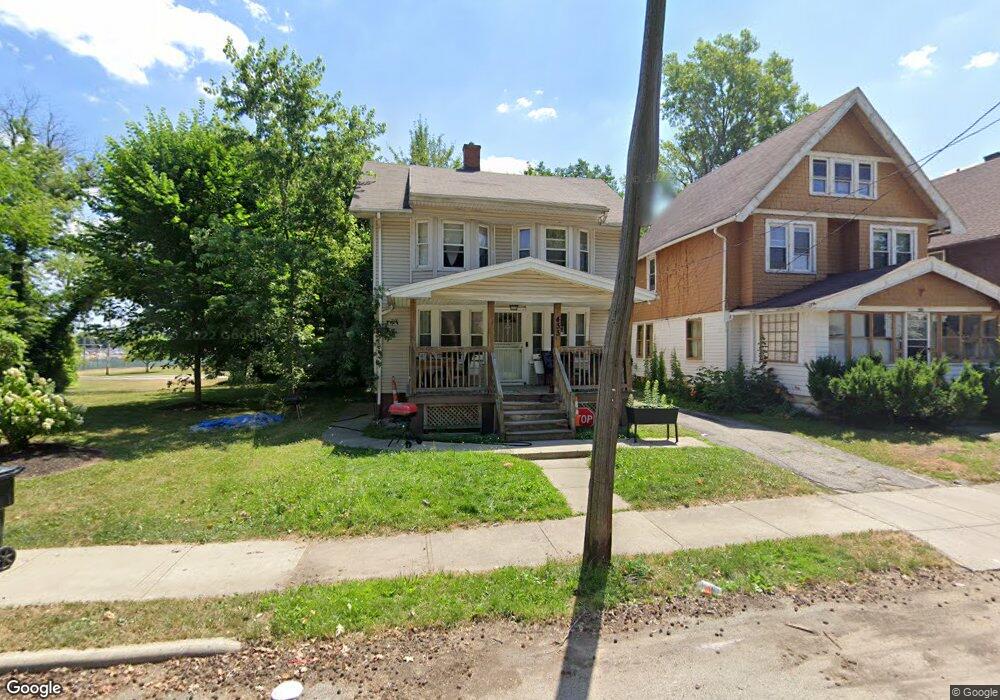
433 E 109th St Cleveland, OH 44108
Glenville NeighborhoodEstimated Value: $71,000 - $93,000
3
Beds
1
Bath
1,313
Sq Ft
$63/Sq Ft
Est. Value
About This Home
This home is located at 433 E 109th St, Cleveland, OH 44108 and is currently estimated at $82,188, approximately $62 per square foot. 433 E 109th St is a home located in Cuyahoga County with nearby schools including Citizens Academy and St. Aloysius - St. Agatha School.
Ownership History
Date
Name
Owned For
Owner Type
Purchase Details
Closed on
Mar 29, 2019
Sold by
Thomas Wayne M
Bought by
Byrd Christopher
Current Estimated Value
Home Financials for this Owner
Home Financials are based on the most recent Mortgage that was taken out on this home.
Original Mortgage
$58,913
Outstanding Balance
$52,742
Interest Rate
5.25%
Mortgage Type
FHA
Estimated Equity
$29,446
Purchase Details
Closed on
Jun 19, 2017
Sold by
Buckner Alonzo Rodney
Bought by
Thomas Wayne M
Home Financials for this Owner
Home Financials are based on the most recent Mortgage that was taken out on this home.
Original Mortgage
$58,913
Interest Rate
4.4%
Mortgage Type
FHA
Purchase Details
Closed on
Jun 3, 2016
Sold by
Cuyahoga County
Bought by
Buckner Alonzo Rodney
Purchase Details
Closed on
Jun 27, 2008
Sold by
Checker Homes Inc and Lesher Marcus
Bought by
Lake John and East 109Th Street Land Trust
Purchase Details
Closed on
May 2, 2008
Sold by
Us Bank Na
Bought by
Checker Homes Inc
Purchase Details
Closed on
Aug 8, 2007
Sold by
Williams Jacqueline L
Bought by
Us Bank Na
Purchase Details
Closed on
Nov 10, 2003
Sold by
Cresthaven Development Inc
Bought by
Williams Jacqueline L
Home Financials for this Owner
Home Financials are based on the most recent Mortgage that was taken out on this home.
Original Mortgage
$85,000
Interest Rate
6.15%
Mortgage Type
Stand Alone First
Purchase Details
Closed on
Sep 2, 2003
Sold by
Fv-1 Inc
Bought by
Cresthaven Development Inc
Purchase Details
Closed on
May 30, 2002
Sold by
Sharpe Derrick and Sharpe Tara
Bought by
Fv 1 Inc
Purchase Details
Closed on
Sep 10, 1999
Sold by
Abrams William C
Bought by
Sharpe Derrick
Home Financials for this Owner
Home Financials are based on the most recent Mortgage that was taken out on this home.
Original Mortgage
$56,000
Interest Rate
9.99%
Purchase Details
Closed on
Sep 18, 1998
Sold by
Dicks Charles C
Bought by
Abrams William C
Home Financials for this Owner
Home Financials are based on the most recent Mortgage that was taken out on this home.
Original Mortgage
$48,750
Interest Rate
6.71%
Mortgage Type
Balloon
Purchase Details
Closed on
May 19, 1994
Sold by
Wadlington James E
Bought by
Sec. Of H.U.D.
Purchase Details
Closed on
Nov 15, 1988
Sold by
Edna Travis
Bought by
Wadlington James E
Purchase Details
Closed on
Oct 31, 1979
Sold by
Travis Thomas J and Travis Edna E
Bought by
Edna Travis
Purchase Details
Closed on
Jan 1, 1975
Bought by
Travis Thomas J and Travis Edna E
Create a Home Valuation Report for This Property
The Home Valuation Report is an in-depth analysis detailing your home's value as well as a comparison with similar homes in the area
Home Values in the Area
Average Home Value in this Area
Purchase History
| Date | Buyer | Sale Price | Title Company |
|---|---|---|---|
| Byrd Christopher | $60,000 | None Available | |
| Thomas Wayne M | $60,000 | Ohio Real Title | |
| Buckner Alonzo Rodney | $7,000 | None Available | |
| Lake John | -- | None Available | |
| Checker Homes Inc | $4,000 | Attorney | |
| Us Bank Na | $40,000 | Attorney | |
| Williams Jacqueline L | $96,000 | -- | |
| Cresthaven Development Inc | $25,000 | Multiple | |
| Fv 1 Inc | $30,000 | -- | |
| Sharpe Derrick | $70,000 | Mountaineer Title Inc | |
| Abrams William C | $65,000 | -- | |
| Sec. Of H.U.D. | -- | -- | |
| Wadlington James E | $24,000 | -- | |
| Edna Travis | -- | -- | |
| Travis Thomas J | -- | -- |
Source: Public Records
Mortgage History
| Date | Status | Borrower | Loan Amount |
|---|---|---|---|
| Open | Byrd Christopher | $58,913 | |
| Previous Owner | Thomas Wayne M | $58,913 | |
| Previous Owner | Williams Jacqueline L | $85,000 | |
| Previous Owner | Sharpe Derrick | $56,000 | |
| Previous Owner | Abrams William C | $48,750 | |
| Closed | Sharpe Derrick | $10,500 | |
| Closed | Williams Jacqueline L | $10,000 |
Source: Public Records
Tax History
| Year | Tax Paid | Tax Assessment Tax Assessment Total Assessment is a certain percentage of the fair market value that is determined by local assessors to be the total taxable value of land and additions on the property. | Land | Improvement |
|---|---|---|---|---|
| 2024 | $920 | $13,755 | $3,010 | $10,745 |
| 2023 | $741 | $9,560 | $2,380 | $7,180 |
| 2022 | $737 | $9,560 | $2,380 | $7,180 |
| 2021 | $730 | $9,560 | $2,380 | $7,180 |
| 2020 | $693 | $7,840 | $1,960 | $5,880 |
| 2019 | $641 | $22,400 | $5,600 | $16,800 |
| 2018 | $1,158 | $7,840 | $1,960 | $5,880 |
| 2017 | $1,348 | $12,430 | $2,170 | $10,260 |
| 2016 | $0 | $16,630 | $2,170 | $14,460 |
| 2015 | $9,469 | $16,630 | $2,170 | $14,460 |
| 2014 | $7,090 | $18,490 | $2,420 | $16,070 |
Source: Public Records
Map
Nearby Homes
- 472 E 110th St
- 10639 Dupont Ave
- 528 E 109th St
- 10626 Dupont Ave
- 550 E 107th St
- 521 E 112th St
- 10811 Sprague Ave
- 10525 Elk Ave
- 10724 Sprague Ave
- 11601 Rutland Ave
- 11701 Ablewhite Ave
- 475 E 118th St
- 519 E 103rd St
- 617 E 117th St
- 512 Eddy Rd
- SL 6 Lakehurst Dr
- 10211 Lakeshore Blvd
- 20 Hamlet Ct
- 554 Eddy Rd
- 680 E 115th St
Your Personal Tour Guide
Ask me questions while you tour the home.