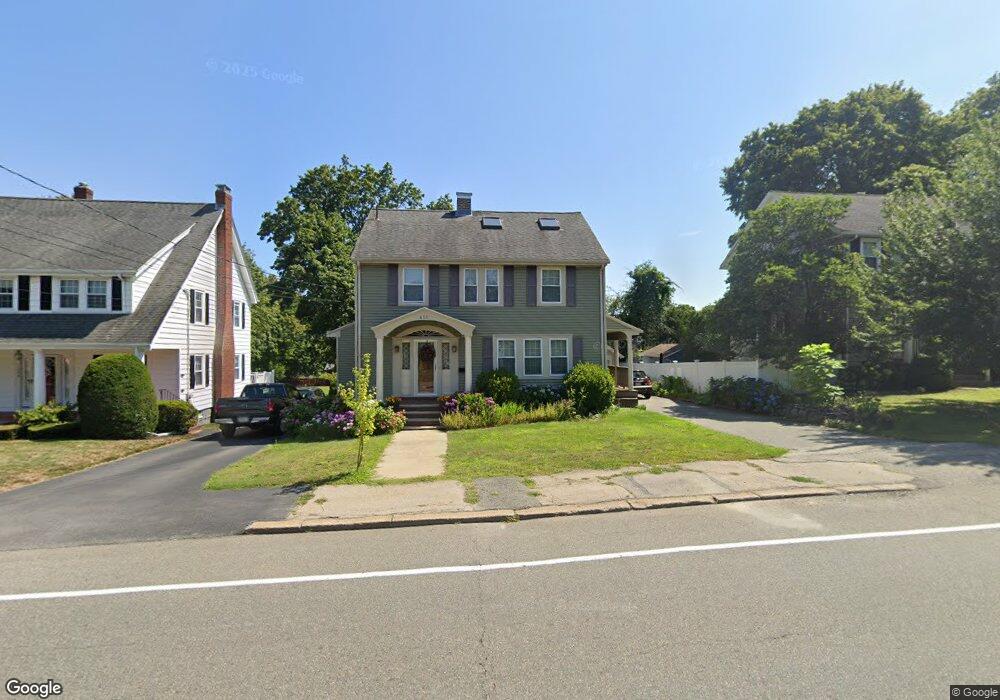
433 Elm St Braintree, MA 02184
East Braintree NeighborhoodEstimated Value: $686,896 - $785,000
4
Beds
2
Baths
1,573
Sq Ft
$468/Sq Ft
Est. Value
About This Home
This home is located at 433 Elm St, Braintree, MA 02184 and is currently estimated at $736,474, approximately $468 per square foot. 433 Elm St is a home located in Norfolk County with nearby schools including Braintree High School, Step Ahead Kindergarten, and Meeting House Montessori School.
Ownership History
Date
Name
Owned For
Owner Type
Purchase Details
Closed on
Mar 18, 2025
Sold by
Jala Wiyada
Bought by
Jala Ft and Jala
Current Estimated Value
Purchase Details
Closed on
Jan 31, 2002
Sold by
Colby Jeremy A and Colby Kimberly E
Bought by
Jala Wiyada and Jala Worawut
Purchase Details
Closed on
Aug 25, 2000
Sold by
Dann George R and Dann Kathleen V
Bought by
Colby Jeremy A and Colby Kimberly E
Purchase Details
Closed on
Dec 14, 1987
Sold by
Hamilton Paul J
Bought by
Golden Joseph J
Create a Home Valuation Report for This Property
The Home Valuation Report is an in-depth analysis detailing your home's value as well as a comparison with similar homes in the area
Home Values in the Area
Average Home Value in this Area
Purchase History
| Date | Buyer | Sale Price | Title Company |
|---|---|---|---|
| Jala Ft | -- | None Available | |
| Jala Ft | -- | None Available | |
| Jala Wiyada | $305,000 | -- | |
| Jala Wiyada | $305,000 | -- | |
| Colby Jeremy A | $269,900 | -- | |
| Golden Joseph J | $159,900 | -- |
Source: Public Records
Mortgage History
| Date | Status | Borrower | Loan Amount |
|---|---|---|---|
| Previous Owner | Golden Joseph J | $60,000 | |
| Previous Owner | Golden Joseph J | $230,000 |
Source: Public Records
Tax History
| Year | Tax Paid | Tax Assessment Tax Assessment Total Assessment is a certain percentage of the fair market value that is determined by local assessors to be the total taxable value of land and additions on the property. | Land | Improvement |
|---|---|---|---|---|
| 2025 | $6,191 | $620,300 | $283,100 | $337,200 |
| 2024 | $5,543 | $584,700 | $261,700 | $323,000 |
| 2023 | $5,328 | $545,900 | $240,200 | $305,700 |
| 2022 | $5,262 | $528,800 | $223,100 | $305,700 |
| 2021 | $4,919 | $494,400 | $205,900 | $288,500 |
| 2020 | $4,875 | $494,400 | $205,900 | $288,500 |
| 2019 | $4,668 | $462,600 | $205,900 | $256,700 |
| 2018 | $4,314 | $409,300 | $163,000 | $246,300 |
| 2017 | $4,102 | $381,900 | $145,900 | $236,000 |
| 2016 | $3,853 | $350,900 | $128,700 | $222,200 |
| 2015 | $3,733 | $337,200 | $123,600 | $213,600 |
| 2014 | $3,673 | $321,600 | $123,600 | $198,000 |
Source: Public Records
Map
Nearby Homes
- 342 Elm St
- 17 White Rd
- 255 River St
- 20 Vine St
- 26 Tingley Rd
- 30 Skyline Dr Unit 6
- 9 Independence Ave Unit 307
- 300 Commercial St Unit 23
- 37 Skyline Dr Unit 11
- 192 Federal Ave Unit B
- 312 Shaw St
- 50 Cleveland Ave
- 25 W Howard St Unit C3
- 14 Hillside Rd
- 599 Union St
- 99 Verchild St
- 155 Kendrick Ave Unit 502
- 36 Chestnut Ave
- 63 Dickerman Ln
- 200 Falls Blvd Unit E101
Your Personal Tour Guide
Ask me questions while you tour the home.