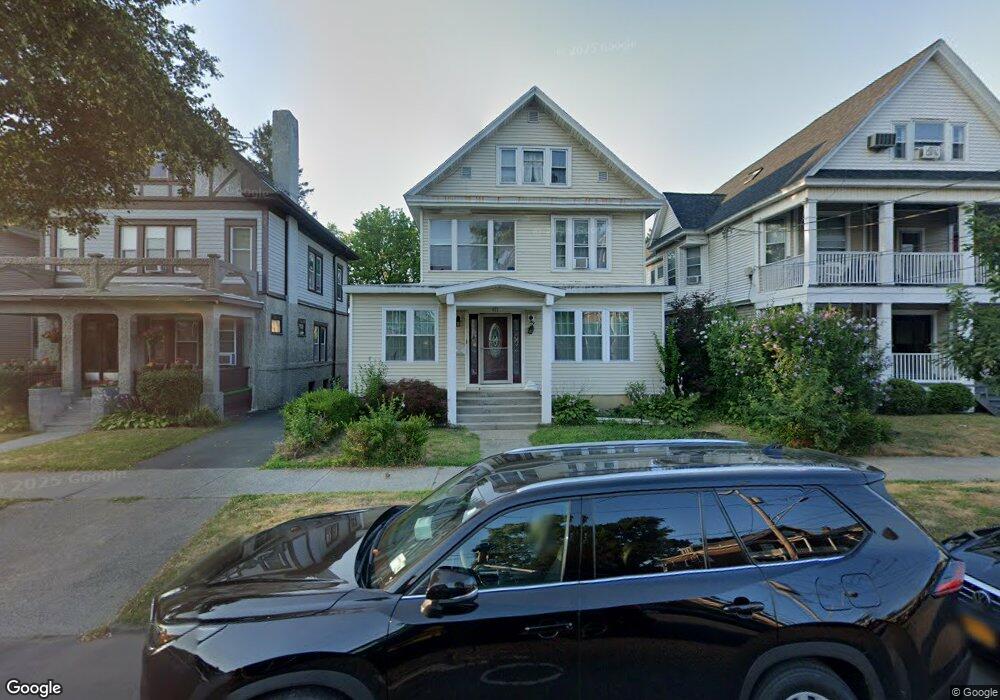
433 Manning Blvd Albany, NY 12206
Beverwyck NeighborhoodEstimated Value: $303,000 - $556,000
5
Beds
2
Baths
2,594
Sq Ft
$154/Sq Ft
Est. Value
About This Home
This home is located at 433 Manning Blvd, Albany, NY 12206 and is currently estimated at $400,438, approximately $154 per square foot. 433 Manning Blvd is a home located in Albany County with nearby schools including Pine Hills Elementary School, Stephen And Harriet Myers Middle School, and Albany High School.
Ownership History
Date
Name
Owned For
Owner Type
Purchase Details
Closed on
Oct 29, 2007
Sold by
Jarrett Teresa R Thomas M
Bought by
Moore-Boakye Sherrmaire
Current Estimated Value
Home Financials for this Owner
Home Financials are based on the most recent Mortgage that was taken out on this home.
Original Mortgage
$215,000
Outstanding Balance
$136,383
Interest Rate
6.43%
Mortgage Type
New Conventional
Estimated Equity
$264,055
Purchase Details
Closed on
Oct 22, 1996
Create a Home Valuation Report for This Property
The Home Valuation Report is an in-depth analysis detailing your home's value as well as a comparison with similar homes in the area
Home Values in the Area
Average Home Value in this Area
Purchase History
| Date | Buyer | Sale Price | Title Company |
|---|---|---|---|
| Moore-Boakye Sherrmaire | $215,000 | Erin Vestal | |
| -- | -- | -- |
Source: Public Records
Mortgage History
| Date | Status | Borrower | Loan Amount |
|---|---|---|---|
| Open | Moore-Boakye Sherrmaire | $215,000 |
Source: Public Records
Tax History Compared to Growth
Tax History
| Year | Tax Paid | Tax Assessment Tax Assessment Total Assessment is a certain percentage of the fair market value that is determined by local assessors to be the total taxable value of land and additions on the property. | Land | Improvement |
|---|---|---|---|---|
| 2024 | $8,359 | $324,000 | $64,800 | $259,200 |
| 2023 | $8,762 | $220,000 | $44,000 | $176,000 |
| 2022 | $8,569 | $220,000 | $44,000 | $176,000 |
| 2021 | $8,550 | $220,000 | $44,000 | $176,000 |
| 2020 | $8,862 | $220,000 | $44,000 | $176,000 |
| 2019 | $8,944 | $220,000 | $44,000 | $176,000 |
| 2018 | $9,039 | $220,000 | $44,000 | $176,000 |
| 2017 | $4,921 | $220,000 | $44,000 | $176,000 |
| 2016 | $8,911 | $220,000 | $44,000 | $176,000 |
| 2015 | $8,410 | $215,000 | $44,400 | $170,600 |
| 2014 | -- | $215,000 | $44,400 | $170,600 |
Source: Public Records
Map
Nearby Homes
- 107 Kent St
- 3 Manning Square
- 87 Kent St
- 94 Kent St
- 184 Benson St
- 9 N Manning Blvd
- 15 N Manning Blvd
- 349 Manning Blvd
- 81 N Main Ave
- 596 3rd St
- 24 Kent St
- 30 Willow St
- 53 N Manning Blvd
- 587 3rd St
- 37-39 N Manning Blvd
- 41-43 N Manning Blvd
- 573 Washington Ave
- 50 N Manning Blvd
- 47 N Main Ave
- 282 Manning Blvd
- 437 Manning Blvd
- 429 Manning Blvd Unit Two
- 429 Manning Blvd
- 439 Manning Blvd
- 427 Manning Blvd
- 425 Manning Blvd
- 441 Manning Blvd
- 421 Manning Blvd
- 419 Manning Blvd
- 419 Manning Blvd Unit 1
- 417 Manning Blvd
- 436 Manning Blvd
- 410 Manning Blvd
- 430 Manning Blvd
- 438 Manning Blvd
- 426 Manning Blvd
- 440 Manning Blvd
- 422 Manning Blvd
- 420 Manning Blvd
- 442 Manning Blvd