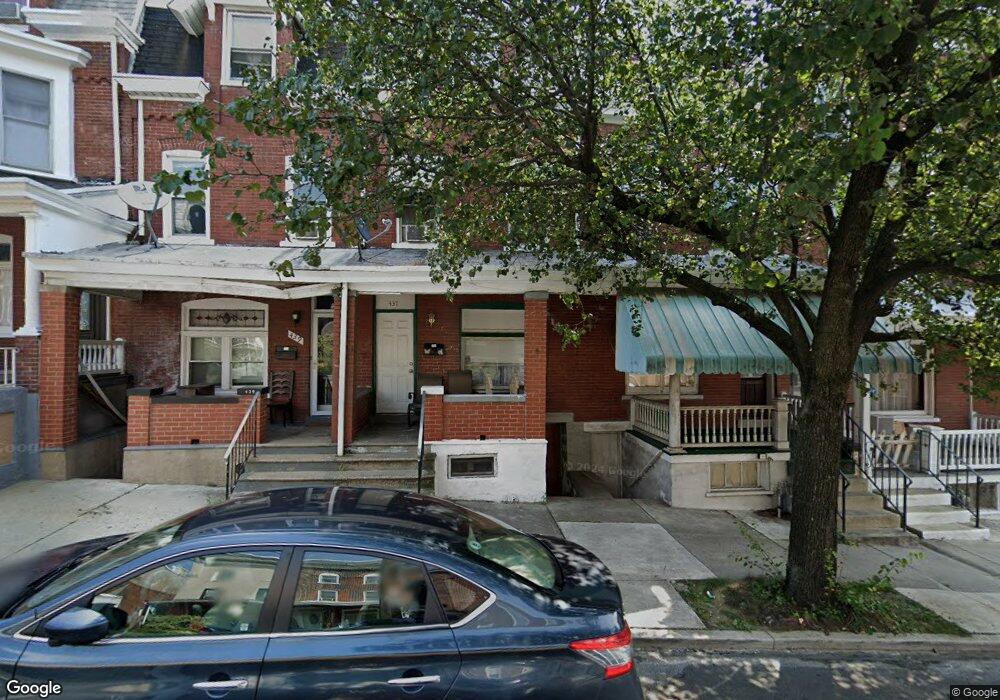
433 N 4th St Allentown, PA 18102
Center City NeighborhoodEstimated Value: $155,000 - $258,000
5
Beds
1
Bath
2,014
Sq Ft
$105/Sq Ft
Est. Value
About This Home
This home is located at 433 N 4th St, Allentown, PA 18102 and is currently estimated at $212,094, approximately $105 per square foot. 433 N 4th St is a home located in Lehigh County with nearby schools including Central Elementary School, Harrison-Morton Middle School, and Louis E. Dieruff High School.
Ownership History
Date
Name
Owned For
Owner Type
Purchase Details
Closed on
Nov 17, 2005
Sold by
Trinchere Renee D
Bought by
Andujar Felix
Current Estimated Value
Home Financials for this Owner
Home Financials are based on the most recent Mortgage that was taken out on this home.
Original Mortgage
$59,360
Outstanding Balance
$36,270
Interest Rate
7.99%
Mortgage Type
Purchase Money Mortgage
Estimated Equity
$175,824
Purchase Details
Closed on
Apr 29, 1981
Bought by
Eberts Tyrone and Eberts Carolyn M
Create a Home Valuation Report for This Property
The Home Valuation Report is an in-depth analysis detailing your home's value as well as a comparison with similar homes in the area
Home Values in the Area
Average Home Value in this Area
Purchase History
| Date | Buyer | Sale Price | Title Company |
|---|---|---|---|
| Andujar Felix | $74,200 | First American Title Ins Co | |
| Eberts Tyrone | $15,000 | -- |
Source: Public Records
Mortgage History
| Date | Status | Borrower | Loan Amount |
|---|---|---|---|
| Open | Andujar Felix | $59,360 |
Source: Public Records
Tax History Compared to Growth
Tax History
| Year | Tax Paid | Tax Assessment Tax Assessment Total Assessment is a certain percentage of the fair market value that is determined by local assessors to be the total taxable value of land and additions on the property. | Land | Improvement |
|---|---|---|---|---|
| 2025 | $2,313 | $71,400 | $5,700 | $65,700 |
| 2024 | $2,313 | $71,400 | $5,700 | $65,700 |
| 2023 | $2,313 | $71,400 | $5,700 | $65,700 |
| 2022 | $2,232 | $71,400 | $65,700 | $5,700 |
| 2021 | $2,187 | $71,400 | $5,700 | $65,700 |
| 2020 | $2,130 | $71,400 | $5,700 | $65,700 |
| 2019 | $2,095 | $71,400 | $5,700 | $65,700 |
| 2018 | $1,957 | $71,400 | $5,700 | $65,700 |
| 2017 | $1,907 | $71,400 | $5,700 | $65,700 |
| 2016 | -- | $71,400 | $5,700 | $65,700 |
| 2015 | -- | $71,400 | $5,700 | $65,700 |
| 2014 | -- | $71,400 | $5,700 | $65,700 |
Source: Public Records
Map
Nearby Homes
- 418 N Jordan St
- 384 W Gordon St
- 440 N 4th St
- 522 N Jordan St
- 424 W Liberty St
- 419 W Liberty St
- 448 W Gordon St
- 454 W Liberty St
- 407 N 5th St
- 308 W Liberty St
- 416 N 5th St
- 514 N 5th St
- 392 W Tilghman St
- 215 W Liberty St
- 643 N 4th St
- 201 N 4th St
- 526 W Gordon St Unit 1
- 436 N Law St
- 701 N Jordan St
- 408 N 2nd St