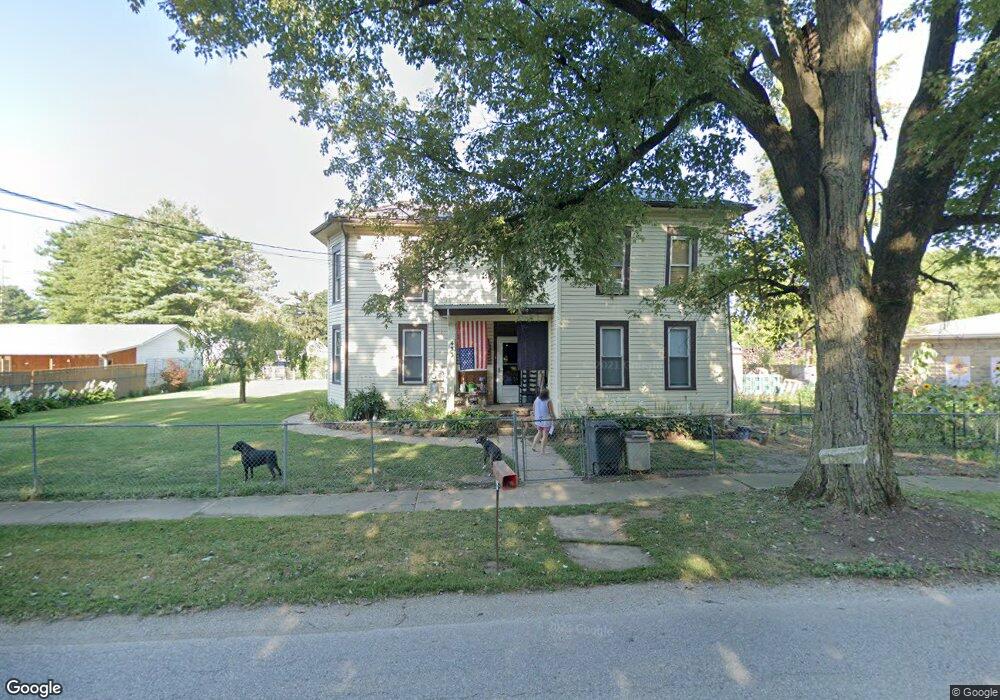
433 N Boundary St Edison, OH 43320
Estimated Value: $176,000 - $269,000
4
Beds
3
Baths
2,200
Sq Ft
$101/Sq Ft
Est. Value
About This Home
This home is located at 433 N Boundary St, Edison, OH 43320 and is currently estimated at $222,801, approximately $101 per square foot. 433 N Boundary St is a home located in Morrow County with nearby schools including Park Avenue Elementary School, Mt Gilead Middle School, and Mt Gilead High School.
Ownership History
Date
Name
Owned For
Owner Type
Purchase Details
Closed on
Mar 7, 2024
Sold by
Cross Janice A
Bought by
Cross Bryan and Cross Debra
Current Estimated Value
Purchase Details
Closed on
Apr 16, 2019
Sold by
Cross Janice A
Bought by
Cross Janice A and Cross Russell D
Purchase Details
Closed on
Aug 13, 2014
Sold by
Daniel Daniel
Bought by
Cross Janice A
Purchase Details
Closed on
Jun 11, 2010
Sold by
Cross Russell Dean and Cross Dawn M
Bought by
Cross Janice A
Purchase Details
Closed on
Nov 8, 2005
Sold by
Cross Janice
Bought by
Cross Janice A and Russell Dean Cross
Purchase Details
Closed on
Feb 21, 2002
Sold by
Cross Sherry L
Bought by
Cross Janice
Purchase Details
Closed on
Mar 27, 1998
Sold by
Cross Janice A
Bought by
Cross Sherry L
Purchase Details
Closed on
Mar 11, 1998
Bought by
Cross Janice A
Purchase Details
Closed on
Jan 28, 1998
Bought by
Ridenour Karon and Athy Boggs Co-Trus
Purchase Details
Closed on
Mar 31, 1992
Bought by
The All Steel Trust
Create a Home Valuation Report for This Property
The Home Valuation Report is an in-depth analysis detailing your home's value as well as a comparison with similar homes in the area
Purchase History
| Date | Buyer | Sale Price | Title Company |
|---|---|---|---|
| Cross Bryan | -- | -- | |
| Cross Janice A | $250 | -- | |
| Cross Janice A | -- | -- | |
| Cross Janice A | -- | -- | |
| Cross Janice A | -- | -- | |
| Cross Janice | $40,000 | -- | |
| Cross Sherry L | $46,000 | -- | |
| Cross Janice A | -- | -- | |
| Ridenour Karon | $46,000 | -- | |
| The All Steel Trust | $16,000 | -- |
Source: Public Records
Tax History
| Year | Tax Paid | Tax Assessment Tax Assessment Total Assessment is a certain percentage of the fair market value that is determined by local assessors to be the total taxable value of land and additions on the property. | Land | Improvement |
|---|---|---|---|---|
| 2025 | $5,500 | $58,530 | $10,750 | $47,780 |
| 2024 | $2,463 | $58,530 | $10,750 | $47,780 |
| 2023 | $2,314 | $58,530 | $10,750 | $47,780 |
| 2022 | $1,776 | $43,270 | $6,410 | $36,860 |
| 2021 | $1,695 | $43,270 | $6,410 | $36,860 |
| 2020 | $1,695 | $43,270 | $6,410 | $36,860 |
| 2019 | $1,402 | $36,370 | $5,390 | $30,980 |
| 2018 | $1,403 | $36,370 | $5,390 | $30,980 |
| 2017 | $1,369 | $36,370 | $5,390 | $30,980 |
| 2016 | $1,261 | $34,410 | $4,760 | $29,650 |
| 2015 | $1,192 | $34,410 | $4,760 | $29,650 |
| 2014 | $1,208 | $34,410 | $4,760 | $29,650 |
| 2013 | $1,268 | $36,230 | $5,010 | $31,220 |
Source: Public Records
Map
Nearby Homes
- 210 State St
- 106 William St
- 0 Township Road 145 Lot B Unit 226004537
- 0 Township Road 145 Lot B Unit 20260082
- 0 Township Road 145 Lot B Unit 9070486
- 0 Township Road 145 Lot A Unit 9070485
- 0 Township Road 145 Lot A Unit 20260081
- 0 Township Road 145 Lot A Unit 226004534
- 3341 Township Highway 145
- 614 Buckeye Ln
- 669 Baker St
- 5720 County Road 30
- 3664 Township Road 145
- 473 N Delaware St
- 324 Lincoln Ave
- 251 Lincoln Ave
- 0 Iberia St
- 202 Iberia St
- 0 Tamarack Unit 223034150
- 211 W Union St
- 436 N Boundary St
- 434 N Boundary St
- 429 N Boundary St
- 430 N Boundary St
- 325 N Boundary St
- 329 Railroad St
- 103 Hill St
- 324 N Boundary St
- 100 State St
- 323 N Boundary St
- 104 Hill St
- 321 N Boundary St
- 101 State St
- 106 Hill St
- 105 Hill St
- 105 Hill St
- 104 State St
- 108 Hill St
- 215 N Boundary St
- 106 State St
Your Personal Tour Guide
Ask me questions while you tour the home.