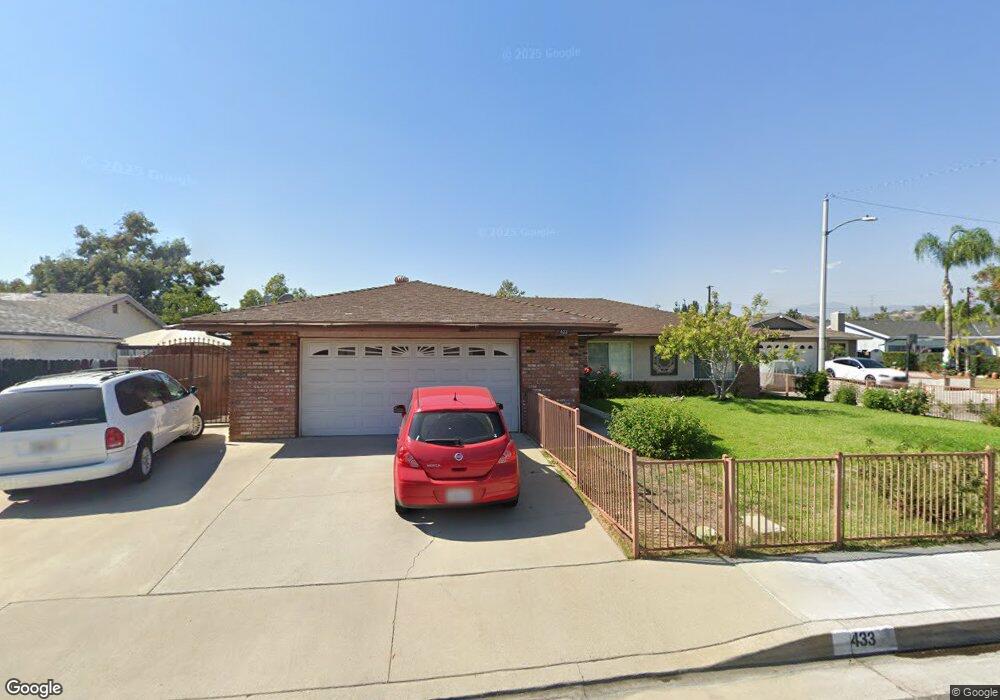
433 N Jansen Ave San Dimas, CA 91773
Estimated Value: $828,032 - $897,000
3
Beds
2
Baths
1,595
Sq Ft
$537/Sq Ft
Est. Value
About This Home
This home is located at 433 N Jansen Ave, San Dimas, CA 91773 and is currently estimated at $857,008, approximately $537 per square foot. 433 N Jansen Ave is a home located in Los Angeles County with nearby schools including Gladstone Elementary School, Lone Hill Middle School, and San Dimas High School.
Ownership History
Date
Name
Owned For
Owner Type
Purchase Details
Closed on
Jul 12, 2018
Sold by
Rallabhandi Murty S
Bought by
Rallabhandi Murty S and Rallabhandi Krishana V
Current Estimated Value
Purchase Details
Closed on
Oct 15, 2012
Sold by
Rallabhandi Murty S and Rallabhandi Krishna V
Bought by
Rallabhandi Murty S and Rallabhandi Krishna
Home Financials for this Owner
Home Financials are based on the most recent Mortgage that was taken out on this home.
Original Mortgage
$224,500
Outstanding Balance
$38,238
Interest Rate
3.32%
Mortgage Type
New Conventional
Estimated Equity
$818,770
Purchase Details
Closed on
May 28, 2003
Sold by
Grigolla Carmen G
Bought by
Rallabhandi Murty S
Home Financials for this Owner
Home Financials are based on the most recent Mortgage that was taken out on this home.
Original Mortgage
$271,200
Interest Rate
5.22%
Mortgage Type
Purchase Money Mortgage
Create a Home Valuation Report for This Property
The Home Valuation Report is an in-depth analysis detailing your home's value as well as a comparison with similar homes in the area
Home Values in the Area
Average Home Value in this Area
Purchase History
| Date | Buyer | Sale Price | Title Company |
|---|---|---|---|
| Rallabhandi Murty S | -- | None Available | |
| Rallabhandi Murty S | -- | None Available | |
| Rallabhandi Murty S | -- | North American Title Co | |
| Rallabhandi Murty S | $339,000 | Southland Title |
Source: Public Records
Mortgage History
| Date | Status | Borrower | Loan Amount |
|---|---|---|---|
| Open | Rallabhandi Murty S | $224,500 | |
| Closed | Rallabhandi Murty S | $271,200 | |
| Closed | Rallabhandi Murty S | $33,900 |
Source: Public Records
Tax History
| Year | Tax Paid | Tax Assessment Tax Assessment Total Assessment is a certain percentage of the fair market value that is determined by local assessors to be the total taxable value of land and additions on the property. | Land | Improvement |
|---|---|---|---|---|
| 2025 | $6,010 | $481,967 | $307,952 | $174,015 |
| 2024 | $6,010 | $472,517 | $301,914 | $170,603 |
| 2023 | $5,877 | $463,253 | $295,995 | $167,258 |
| 2022 | $5,782 | $454,171 | $290,192 | $163,979 |
| 2021 | $5,670 | $445,266 | $284,502 | $160,764 |
| 2019 | $5,562 | $432,061 | $276,064 | $155,997 |
| 2018 | $5,237 | $423,590 | $270,651 | $152,939 |
| 2016 | $4,962 | $407,144 | $260,143 | $147,001 |
| 2015 | $4,882 | $401,029 | $256,236 | $144,793 |
| 2014 | $4,835 | $393,174 | $251,217 | $141,957 |
Source: Public Records
Map
Nearby Homes
- 514 N Balton Ave
- 1353 W Arrow Hwy
- 1245 W Cienega Ave Unit 160
- 1245 W Cienega Ave Unit 211
- 1245 W Cienega Ave Unit 154
- 1245 W Cienega Ave Unit 60
- 1245 W Cienega Ave Unit 46
- 1245 W Cienega Ave Unit 75
- 1245 W Cienega Ave Sp 162
- 1032 E Juanita Ave
- 21210 E Arrow Hwy Unit 158
- 21210 E Arrow Hwy Unit 92
- 21210 E Arrow Hwy
- 1137 Willow Ave
- 703 N Aguirre Ave
- 631 Pearlanna Dr
- 1205 Stratford Ln
- 905 E Juanita Ave
- 1951 Cobblefield Way Unit 4
- 21301 E Greenhaven St
- 425 N Jansen Ave
- 503 N Jansen Ave
- 1240 W Kirkwall Rd
- 509 N Jansen Ave
- 417 N Jansen Ave
- 424 N Jansen Ave
- 1243 W Kirkwall Rd
- 515 N Jansen Ave
- 1237 W Kirkwall Rd
- 416 N Jansen Ave
- 409 N Jansen Ave
- 439 N Rennell Ave
- 433 N Rennell Ave
- 521 N Jansen Ave
- 427 N Rennell Ave
- 1229 W Kirkwall Rd
- 421 N Rennell Ave
- 1242 W Payson St
- 527 N Jansen Ave
- 1261 W Juanita Ave
Your Personal Tour Guide
Ask me questions while you tour the home.