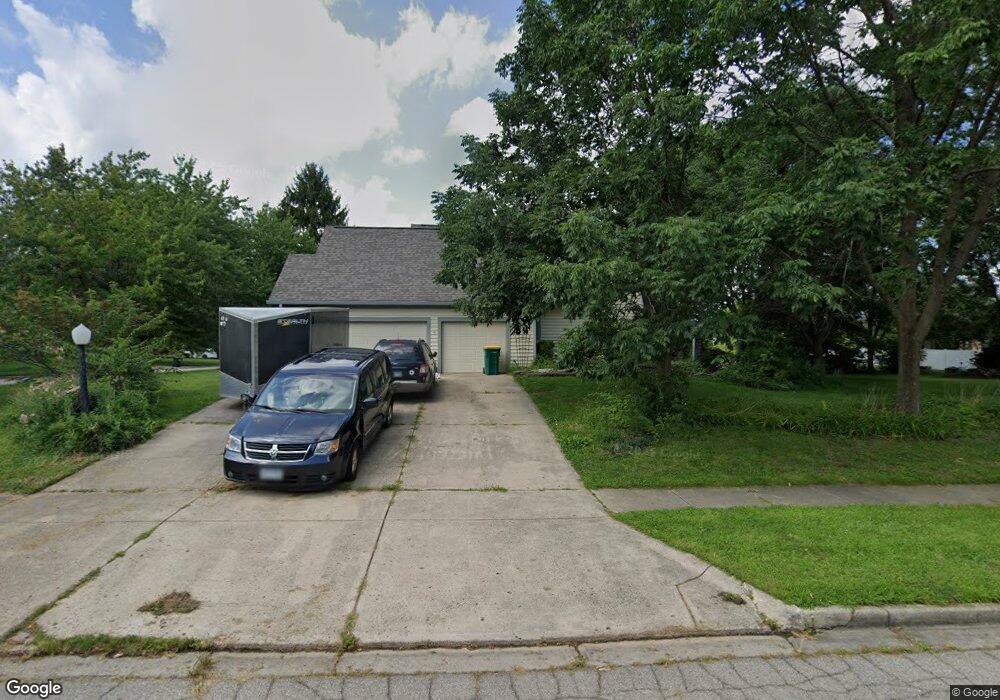
433 Ramsgate Dr Beavercreek, OH 45430
Estimated Value: $554,000 - $605,000
4
Beds
5
Baths
4,147
Sq Ft
$138/Sq Ft
Est. Value
About This Home
This home is located at 433 Ramsgate Dr, Beavercreek, OH 45430 and is currently estimated at $572,155, approximately $137 per square foot. 433 Ramsgate Dr is a home located in Greene County with nearby schools including Fairbrook Elementary School, Herman K Ankeney Middle School, and Beavercreek High School.
Ownership History
Date
Name
Owned For
Owner Type
Purchase Details
Closed on
Aug 9, 2019
Sold by
Harman Michael John and Harman Tracy Ann
Bought by
Derbis Richard and Derbis Rachel M
Current Estimated Value
Home Financials for this Owner
Home Financials are based on the most recent Mortgage that was taken out on this home.
Original Mortgage
$408,600
Outstanding Balance
$357,858
Interest Rate
3.7%
Mortgage Type
VA
Estimated Equity
$214,297
Purchase Details
Closed on
May 21, 2018
Sold by
Harman Michael J and Harman Tracy A
Bought by
Harman Michael John and Harman Tracy Ann
Purchase Details
Closed on
Feb 19, 2009
Sold by
Parnell William C and Parnell Darlene J
Bought by
Harman Michael J and Harman Tracy A
Home Financials for this Owner
Home Financials are based on the most recent Mortgage that was taken out on this home.
Original Mortgage
$308,600
Interest Rate
4.91%
Mortgage Type
Unknown
Create a Home Valuation Report for This Property
The Home Valuation Report is an in-depth analysis detailing your home's value as well as a comparison with similar homes in the area
Home Values in the Area
Average Home Value in this Area
Purchase History
| Date | Buyer | Sale Price | Title Company |
|---|---|---|---|
| Derbis Richard | $400,000 | None Available | |
| Harman Michael John | -- | None Available | |
| Harman Michael J | $342,900 | Attorney |
Source: Public Records
Mortgage History
| Date | Status | Borrower | Loan Amount |
|---|---|---|---|
| Open | Derbis Richard | $408,600 | |
| Previous Owner | Harman Michael J | $308,600 |
Source: Public Records
Tax History
| Year | Tax Paid | Tax Assessment Tax Assessment Total Assessment is a certain percentage of the fair market value that is determined by local assessors to be the total taxable value of land and additions on the property. | Land | Improvement |
|---|---|---|---|---|
| 2024 | $10,352 | $154,020 | $27,910 | $126,110 |
| 2023 | $10,255 | $154,020 | $27,910 | $126,110 |
| 2022 | $9,747 | $129,220 | $21,470 | $107,750 |
| 2021 | $9,555 | $129,220 | $21,470 | $107,750 |
| 2020 | $9,627 | $129,220 | $21,470 | $107,750 |
| 2019 | $8,613 | $107,700 | $19,790 | $87,910 |
| 2018 | $7,779 | $107,700 | $19,790 | $87,910 |
| 2017 | $7,649 | $107,700 | $19,790 | $87,910 |
| 2016 | $7,818 | $104,840 | $19,790 | $85,050 |
| 2015 | $7,774 | $104,840 | $19,790 | $85,050 |
| 2014 | $7,661 | $104,840 | $19,790 | $85,050 |
Source: Public Records
Map
Nearby Homes
- 2658 Tompkins Place
- 2759 Shelburne Ln
- 438 Grange Hall Rd
- 635 Breckenridge Way
- 4300 Straight Arrow Rd Unit 4300
- 3867 Lofty Oaks Dr
- 3785 Frostwood Dr
- 629 Bungalow Ct
- 3978 Indian Ripple Rd
- 3958 Oakmont Way
- 4385 Weber Dr
- 615 Bendwood Way
- 208 Glenview Dr
- 3167 Gracemore Ave
- 205 Elmwood Place
- 3597 Echo Hill Ln
- 3985 Shagbark Ln
- 3081 Glengarry Dr
- 2808 Whitehorse Ave
- 3774 Red Oak Ct
- 4220 Pennywood Dr
- 439 Ramsgate Dr
- 4224 Pennywood Dr
- 430 Ramsgate Dr
- 428 Ramsgate Dr
- 455 Terri Ct
- 4219 Pennywood Dr
- 4215 Pennywood Dr
- 432 Ramsgate Dr
- 4223 Pennywood Dr
- 4211 Pennywood Dr
- 4228 Pennywood Dr
- 4227 Pennywood Dr
- 434 Ramsgate Dr
- 459 Terri Ct
- 445 Ramsgate Dr
- 4172 Pennywood Dr
- 4192 Pennywood Dr
- 458 Terri Ct
- 436 Ramsgate Dr
Your Personal Tour Guide
Ask me questions while you tour the home.