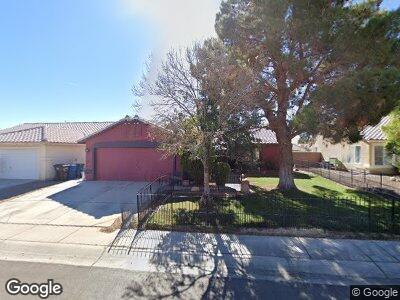
433 Rancho Del Mar Way North Las Vegas, NV 89031
Craig Ranch NeighborhoodEstimated Value: $355,439 - $386,000
3
Beds
2
Baths
1,204
Sq Ft
$307/Sq Ft
Est. Value
About This Home
This home is located at 433 Rancho Del Mar Way, North Las Vegas, NV 89031 and is currently estimated at $369,860, approximately $307 per square foot. 433 Rancho Del Mar Way is a home located in Clark County with nearby schools including Raul P. Elizondo Elementary School, Clifford O. Findlay Middle School, and Mojave High School.
Ownership History
Date
Name
Owned For
Owner Type
Purchase Details
Closed on
Dec 16, 2021
Sold by
Martin and Gus
Bought by
Martin Brenda and Martin Gus
Current Estimated Value
Purchase Details
Closed on
Aug 26, 2020
Sold by
Martin Brenda
Bought by
Martin Brenda and Martin Gus
Home Financials for this Owner
Home Financials are based on the most recent Mortgage that was taken out on this home.
Original Mortgage
$105,400
Interest Rate
2.9%
Mortgage Type
New Conventional
Purchase Details
Closed on
Jun 13, 2001
Sold by
Gutierrez Marcella
Bought by
Cotton Brenda F
Home Financials for this Owner
Home Financials are based on the most recent Mortgage that was taken out on this home.
Original Mortgage
$116,350
Interest Rate
7.14%
Purchase Details
Closed on
Oct 2, 1997
Sold by
Kimball Hill Homes Nevada Inc
Bought by
Gutierrez Marcella
Home Financials for this Owner
Home Financials are based on the most recent Mortgage that was taken out on this home.
Original Mortgage
$102,914
Interest Rate
7.54%
Mortgage Type
FHA
Create a Home Valuation Report for This Property
The Home Valuation Report is an in-depth analysis detailing your home's value as well as a comparison with similar homes in the area
Home Values in the Area
Average Home Value in this Area
Purchase History
| Date | Buyer | Sale Price | Title Company |
|---|---|---|---|
| Martin Brenda | -- | None Listed On Document | |
| Martin Brenda | -- | Ticor Title Las Vegas Sum | |
| Cotton Brenda F | $122,500 | Old Republic Title Company | |
| Gutierrez Marcella | $106,000 | United Title |
Source: Public Records
Mortgage History
| Date | Status | Borrower | Loan Amount |
|---|---|---|---|
| Previous Owner | Martin Brenda | $105,400 | |
| Previous Owner | Cotton Brenda F | $168,000 | |
| Previous Owner | Cotton Brenda F | $116,350 | |
| Previous Owner | Gutierrez Marcella | $102,914 |
Source: Public Records
Tax History Compared to Growth
Tax History
| Year | Tax Paid | Tax Assessment Tax Assessment Total Assessment is a certain percentage of the fair market value that is determined by local assessors to be the total taxable value of land and additions on the property. | Land | Improvement |
|---|---|---|---|---|
| 2025 | $1,249 | $83,242 | $32,200 | $51,042 |
| 2024 | $1,213 | $83,242 | $32,200 | $51,042 |
| 2023 | $1,213 | $78,908 | $30,450 | $48,458 |
| 2022 | $1,235 | $70,386 | $25,900 | $44,486 |
| 2021 | $1,195 | $64,010 | $21,700 | $42,310 |
| 2020 | $1,147 | $63,447 | $21,350 | $42,097 |
| 2019 | $1,075 | $59,004 | $17,500 | $41,504 |
| 2018 | $1,026 | $54,502 | $14,350 | $40,152 |
| 2017 | $1,722 | $51,350 | $12,600 | $38,750 |
| 2016 | $961 | $40,219 | $8,400 | $31,819 |
| 2015 | $958 | $33,756 | $5,950 | $27,806 |
| 2014 | $930 | $28,621 | $5,950 | $22,671 |
Source: Public Records
Map
Nearby Homes
- 5041 Vista Del Rancho Way
- 529 Rancho Del Mar Way
- 534 Rancho Del Mar Way
- 5025 Vista Loma Way
- 319 Mulberry Glen Dr
- 5147 Stonecrop St
- 5136 Stonecrop St
- 4938 Via Luis Ct
- 523 Rancho Del Norte Dr
- 5236 Krista Alethea St
- 4919 Rancho Domingo Ct
- 702 Carlitos Ave
- 4841 Crystal Sword St
- 13 Deseo Ct
- 412 Orchid Oasis Ave
- 628 Carlos Julio Ave
- 320 Point Loma Ave
- 652 Carlos Julio Ave
- 1025 Chestnut Bay Ave
- 5136 Eagle Way
- 433 Rancho Del Mar Way
- 429 Rancho Del Mar Way
- 437 Rancho Del Mar Way
- 434 Don Pedro Cir
- 430 Don Pedro Cir
- 425 Rancho Del Mar Way
- 505 Rancho Del Mar Way
- 434 Rancho Del Mar Way
- 426 Don Pedro Cir
- 430 Rancho Del Mar Way
- 438 Rancho Del Mar Way Unit 4
- 438 Don Pedro Cir
- 421 Rancho Del Mar Way
- 509 Rancho Del Mar Way
- 510 Rio Largo Way
- 422 Don Pedro Cir Unit 9
- 5153 Comida Ln
- 5152 Cantina Ln
- 510 Rancho Del Mar Way
- 5146 Comida Ln