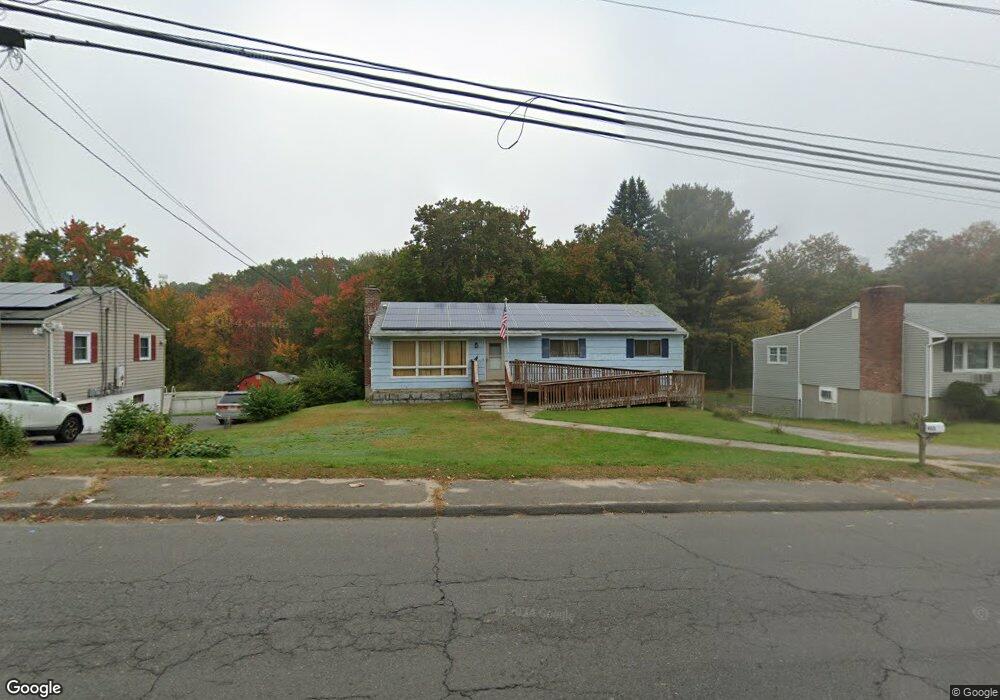
433 Scott Rd Waterbury, CT 06705
Estimated Value: $304,236 - $414,000
3
Beds
2
Baths
1,352
Sq Ft
$262/Sq Ft
Est. Value
About This Home
This home is located at 433 Scott Rd, Waterbury, CT 06705 and is currently estimated at $354,309, approximately $262 per square foot. 433 Scott Rd is a home located in New Haven County with nearby schools including Margaret M. Generali Elementary School, Michael F. Wallace Middle School, and Crosby High School.
Ownership History
Date
Name
Owned For
Owner Type
Purchase Details
Closed on
Nov 1, 1999
Sold by
Hartley Dorothy M Est and Hartley
Bought by
Butler Kenneth P and Butler Cynthia G
Current Estimated Value
Home Financials for this Owner
Home Financials are based on the most recent Mortgage that was taken out on this home.
Original Mortgage
$101,600
Interest Rate
7.78%
Mortgage Type
Purchase Money Mortgage
Create a Home Valuation Report for This Property
The Home Valuation Report is an in-depth analysis detailing your home's value as well as a comparison with similar homes in the area
Home Values in the Area
Average Home Value in this Area
Purchase History
| Date | Buyer | Sale Price | Title Company |
|---|---|---|---|
| Butler Kenneth P | $103,000 | -- |
Source: Public Records
Mortgage History
| Date | Status | Borrower | Loan Amount |
|---|---|---|---|
| Open | Butler Kenneth P | $152,800 | |
| Closed | Butler Kenneth P | $131,622 | |
| Closed | Butler Kenneth P | $110,500 | |
| Closed | Butler Kenneth P | $101,600 | |
| Closed | Butler Kenneth P | $3,100 |
Source: Public Records
Tax History Compared to Growth
Tax History
| Year | Tax Paid | Tax Assessment Tax Assessment Total Assessment is a certain percentage of the fair market value that is determined by local assessors to be the total taxable value of land and additions on the property. | Land | Improvement |
|---|---|---|---|---|
| 2025 | $6,666 | $148,190 | $22,750 | $125,440 |
| 2024 | $7,327 | $148,190 | $22,750 | $125,440 |
| 2023 | $8,030 | $148,190 | $22,750 | $125,440 |
| 2022 | $5,212 | $86,570 | $22,730 | $63,840 |
| 2021 | $5,212 | $86,570 | $22,730 | $63,840 |
| 2020 | $5,212 | $86,570 | $22,730 | $63,840 |
| 2019 | $5,212 | $86,570 | $22,730 | $63,840 |
| 2018 | $5,212 | $86,570 | $22,730 | $63,840 |
| 2017 | $5,517 | $91,630 | $22,740 | $68,890 |
| 2016 | $5,517 | $91,630 | $22,740 | $68,890 |
| 2015 | $5,335 | $91,630 | $22,740 | $68,890 |
| 2014 | $5,335 | $91,630 | $22,740 | $68,890 |
Source: Public Records
Map
Nearby Homes
- 425 Scott Rd
- 379 Scott Rd
- 519 Scott Rd Unit 60
- 268 Scott Rd Unit 3
- 260 Scott Rd Unit 1
- 9 Lilac Ln Unit 9
- 8 Hickory Dr Unit 8
- 2916 E Main St
- 31 Tamarack Ct Unit 31
- 11 Tamarack Ct Unit 11
- 3280 E Main St
- 11 Poplar Dr Unit 11
- 3221 E Main St Unit B
- 24 Alton St
- 110 Midland Rd
- 280 Ridgefield Ave
- 70 Glenrock Rd
- 135 Norris St
- 207 Ridgefield Ave
- 91 Piping Rock Dr