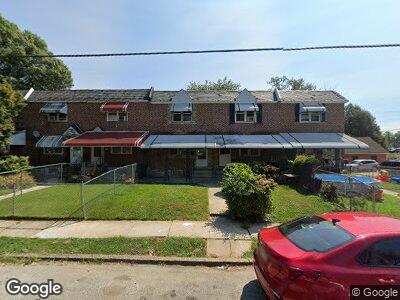
433 W 21st St Chester, PA 19013
Estimated Value: $115,248 - $147,000
3
Beds
1
Bath
1,152
Sq Ft
$118/Sq Ft
Est. Value
About This Home
This home is located at 433 W 21st St, Chester, PA 19013 and is currently estimated at $136,312, approximately $118 per square foot. 433 W 21st St is a home located in Delaware County with nearby schools including Widener Partnership Charter School, Drexel Newman Academy, and Institute of Islamic Studies.
Ownership History
Date
Name
Owned For
Owner Type
Purchase Details
Closed on
Oct 22, 2019
Sold by
Zmuda Louis G and Estate Of Julian Zmuda
Bought by
Zmuda Louis G
Current Estimated Value
Purchase Details
Closed on
Apr 5, 2006
Sold by
Mower Emma F and Mower George J
Bought by
Zmuda Julian and Zmuda Genevieve
Home Financials for this Owner
Home Financials are based on the most recent Mortgage that was taken out on this home.
Original Mortgage
$58,400
Interest Rate
6.17%
Mortgage Type
Purchase Money Mortgage
Create a Home Valuation Report for This Property
The Home Valuation Report is an in-depth analysis detailing your home's value as well as a comparison with similar homes in the area
Home Values in the Area
Average Home Value in this Area
Purchase History
| Date | Buyer | Sale Price | Title Company |
|---|---|---|---|
| Zmuda Louis G | -- | None Available | |
| Zmuda Julian | $73,000 | None Available |
Source: Public Records
Mortgage History
| Date | Status | Borrower | Loan Amount |
|---|---|---|---|
| Previous Owner | Zmuda Julian | $58,400 |
Source: Public Records
Tax History Compared to Growth
Tax History
| Year | Tax Paid | Tax Assessment Tax Assessment Total Assessment is a certain percentage of the fair market value that is determined by local assessors to be the total taxable value of land and additions on the property. | Land | Improvement |
|---|---|---|---|---|
| 2024 | $653 | $35,010 | $8,060 | $26,950 |
| 2023 | $682 | $35,010 | $8,060 | $26,950 |
| 2022 | $700 | $35,010 | $8,060 | $26,950 |
| 2021 | $1,090 | $35,010 | $8,060 | $26,950 |
| 2020 | $1,466 | $42,710 | $11,080 | $31,630 |
| 2019 | $1,470 | $42,710 | $11,080 | $31,630 |
| 2018 | $1,448 | $42,710 | $0 | $0 |
| 2017 | $1,420 | $42,710 | $0 | $0 |
| 2016 | $234 | $42,710 | $0 | $0 |
| 2015 | $234 | $42,710 | $0 | $0 |
| 2014 | $234 | $42,710 | $0 | $0 |
Source: Public Records
Map
Nearby Homes