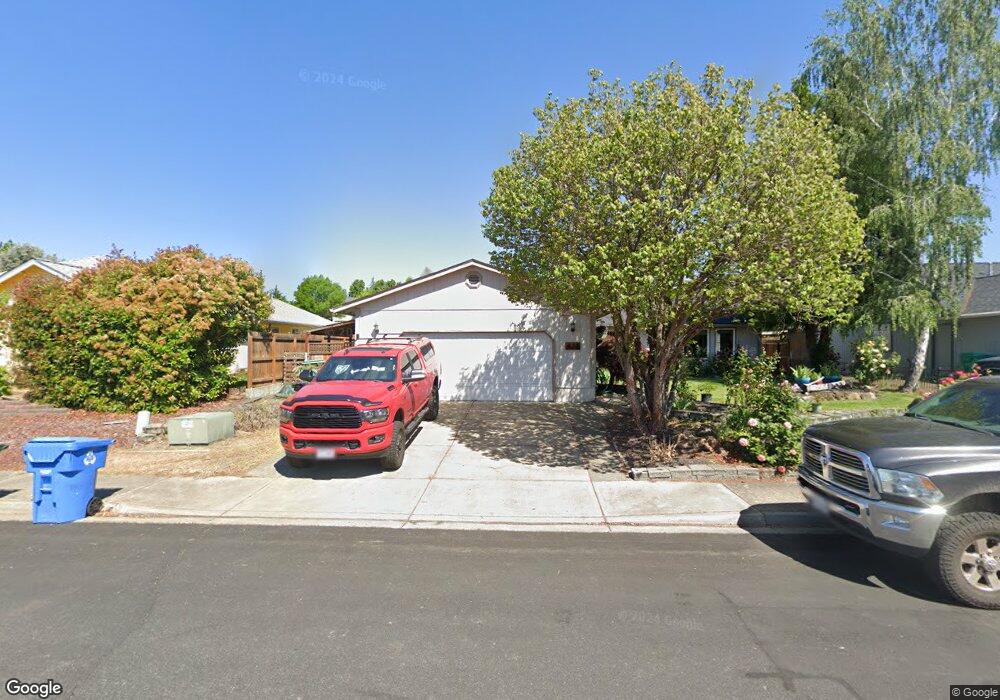
433 Westminster Dr Eagle Point, OR 97524
Estimated Value: $402,000 - $409,000
3
Beds
2
Baths
1,704
Sq Ft
$238/Sq Ft
Est. Value
About This Home
This home is located at 433 Westminster Dr, Eagle Point, OR 97524 and is currently estimated at $405,360, approximately $237 per square foot. 433 Westminster Dr is a home located in Jackson County with nearby schools including Eagle Rock Elementary School, Eagle Point Middle School, and White Mountain Middle School.
Ownership History
Date
Name
Owned For
Owner Type
Purchase Details
Closed on
Dec 11, 2009
Sold by
Federal National Mortgage Association
Bought by
Lafever James R
Current Estimated Value
Home Financials for this Owner
Home Financials are based on the most recent Mortgage that was taken out on this home.
Original Mortgage
$181,550
Outstanding Balance
$117,642
Interest Rate
5.01%
Mortgage Type
FHA
Estimated Equity
$287,718
Purchase Details
Closed on
Sep 17, 2009
Sold by
Hyden Dewey C
Bought by
Federal National Mortgage Association
Purchase Details
Closed on
Oct 17, 2003
Sold by
Tribon Sheryl Lynn M and Mollett Lynn M
Bought by
Tribon Jeffrey D and Tribon Sheryl Lynn M
Purchase Details
Closed on
Jun 6, 2001
Sold by
Crown West Developments
Bought by
Mollett Lynn M
Home Financials for this Owner
Home Financials are based on the most recent Mortgage that was taken out on this home.
Original Mortgage
$105,000
Interest Rate
7.14%
Mortgage Type
Credit Line Revolving
Create a Home Valuation Report for This Property
The Home Valuation Report is an in-depth analysis detailing your home's value as well as a comparison with similar homes in the area
Home Values in the Area
Average Home Value in this Area
Purchase History
| Date | Buyer | Sale Price | Title Company |
|---|---|---|---|
| Lafever James R | $184,900 | Ticor Title | |
| Federal National Mortgage Association | $254,144 | Accommodation | |
| Tribon Jeffrey D | -- | -- | |
| Mollett Lynn M | $37,500 | Lawyers Title Insurance Corp |
Source: Public Records
Mortgage History
| Date | Status | Borrower | Loan Amount |
|---|---|---|---|
| Open | Lafever James R | $181,550 | |
| Previous Owner | Mollett Lynn M | $105,000 |
Source: Public Records
Tax History
| Year | Tax Paid | Tax Assessment Tax Assessment Total Assessment is a certain percentage of the fair market value that is determined by local assessors to be the total taxable value of land and additions on the property. | Land | Improvement |
|---|---|---|---|---|
| 2026 | $3,064 | $225,170 | -- | -- |
| 2025 | $2,992 | $218,620 | $63,860 | $154,760 |
| 2024 | $2,992 | $212,260 | $61,990 | $150,270 |
| 2023 | $2,890 | $206,080 | $60,180 | $145,900 |
| 2022 | $2,811 | $206,080 | $60,180 | $145,900 |
| 2021 | $2,728 | $200,080 | $58,420 | $141,660 |
| 2020 | $2,898 | $194,260 | $56,720 | $137,540 |
| 2019 | $2,854 | $183,120 | $53,470 | $129,650 |
| 2018 | $2,800 | $177,790 | $51,910 | $125,880 |
| 2017 | $2,731 | $177,790 | $51,910 | $125,880 |
| 2016 | $2,678 | $167,600 | $48,930 | $118,670 |
| 2015 | $2,590 | $167,600 | $48,930 | $118,670 |
| 2014 | $2,516 | $157,990 | $46,130 | $111,860 |
Source: Public Records
Map
Nearby Homes
- 426 Westminster Dr
- 1017 Havenwood Dr
- 1044 Havenwood Dr
- 1023 Highlands Dr
- 208 Northview Dr Unit 1B
- 945 Win Way
- 584 Barton Rd
- 460 Montclair Way
- 911 Stonewater Dr
- 917 Stonewater Dr
- 912 Stonewater Dr
- 925 Sellwood Dr
- 633 E Archwood Dr Unit 89
- 633 E Archwood Dr Unit 86
- 633 E Archwood Dr Unit 44
- 633 E Archwood Dr Unit 12
- 633 E Archwood Dr Unit 70
- 633 E Archwood Dr Unit 53
- 633 E Archwood Dr Unit 130
- 633 E Archwood Dr Unit 125
- 439 Westminster Dr
- 500 Winston Ct
- 514 Winston Ct
- 445 Westminster Dr
- 511 Coventry Ct
- 432 Westminster Dr
- 421 Westminster Dr
- 520 Winston Ct
- 444 Westminster Dr
- 513 Winston Ct
- 420 Westminster Dr
- 519 Winston Ct
- 450 Westminster Dr
- 517 Coventry Ct
- 415 Westminster Dr
- 526 Winston Ct
- 502 Coventry Ct
- 431 Garden Cir
- 416 Westminster Dr
- 525 Winston Ct
Your Personal Tour Guide
Ask me questions while you tour the home.