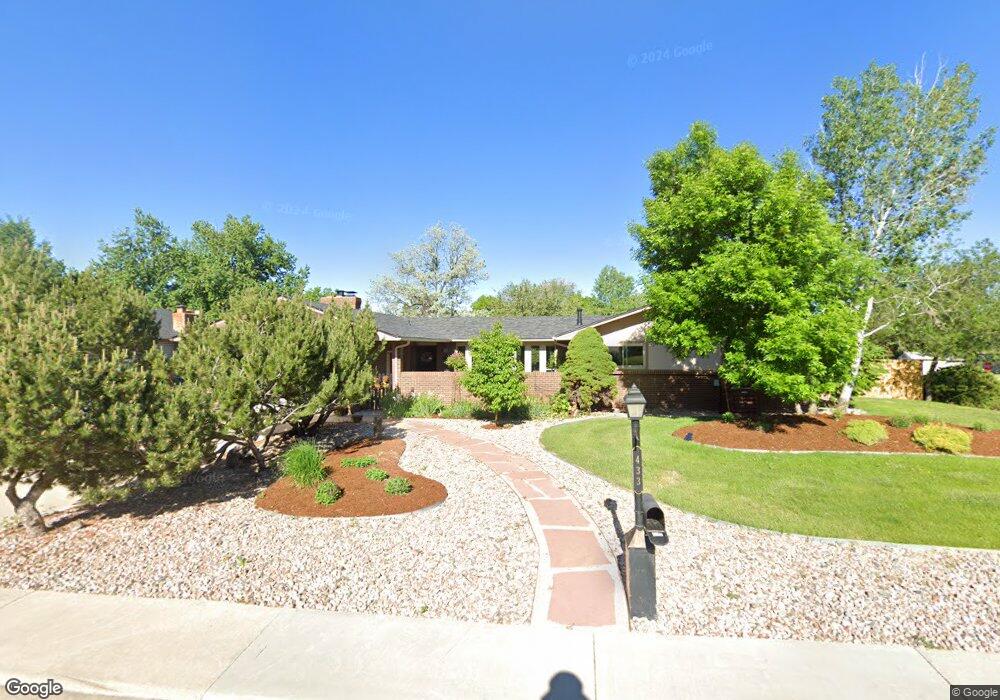
433 Westview Ct Longmont, CO 80504
Kensington NeighborhoodEstimated Value: $653,727 - $786,000
4
Beds
3
Baths
2,254
Sq Ft
$322/Sq Ft
Est. Value
About This Home
This home is located at 433 Westview Ct, Longmont, CO 80504 and is currently estimated at $724,932, approximately $321 per square foot. 433 Westview Ct is a home located in Boulder County with nearby schools including Rocky Mountain Elementary School, Trail Ridge Middle School, and Skyline High School.
Ownership History
Date
Name
Owned For
Owner Type
Purchase Details
Closed on
Apr 3, 2015
Sold by
Starry Gloria Parker
Bought by
Mallard Gloria Parker
Current Estimated Value
Purchase Details
Closed on
Jun 1, 1998
Sold by
Lea Halliday Larry Arnold and Lea Linda
Bought by
Starry Gloria P
Home Financials for this Owner
Home Financials are based on the most recent Mortgage that was taken out on this home.
Original Mortgage
$227,000
Interest Rate
7.2%
Create a Home Valuation Report for This Property
The Home Valuation Report is an in-depth analysis detailing your home's value as well as a comparison with similar homes in the area
Home Values in the Area
Average Home Value in this Area
Purchase History
| Date | Buyer | Sale Price | Title Company |
|---|---|---|---|
| Mallard Gloria Parker | -- | None Available | |
| Starry Gloria P | $239,000 | First American Heritage Titl |
Source: Public Records
Mortgage History
| Date | Status | Borrower | Loan Amount |
|---|---|---|---|
| Previous Owner | Starry Gloria P | $227,000 |
Source: Public Records
Tax History Compared to Growth
Tax History
| Year | Tax Paid | Tax Assessment Tax Assessment Total Assessment is a certain percentage of the fair market value that is determined by local assessors to be the total taxable value of land and additions on the property. | Land | Improvement |
|---|---|---|---|---|
| 2025 | $3,253 | $40,807 | $13,944 | $26,863 |
| 2024 | $3,253 | $40,807 | $13,944 | $26,863 |
| 2023 | $3,208 | $40,703 | $15,410 | $28,978 |
| 2022 | $2,542 | $32,637 | $10,877 | $21,760 |
| 2021 | $2,575 | $33,577 | $11,190 | $22,387 |
| 2020 | $2,362 | $31,468 | $9,939 | $21,529 |
| 2019 | $2,325 | $31,468 | $9,939 | $21,529 |
| 2018 | $2,895 | $30,478 | $7,344 | $23,134 |
| 2017 | $2,856 | $33,694 | $8,119 | $25,575 |
| 2016 | $2,579 | $26,984 | $10,348 | $16,636 |
| 2015 | $2,458 | $23,411 | $4,856 | $18,555 |
| 2014 | $2,187 | $23,411 | $4,856 | $18,555 |
Source: Public Records
Map
Nearby Homes
- 448 Morgan Rd
- 613 Rider Ridge Dr
- 618 Silver Star Ct
- 405 Elliott St
- 729 Brookside Dr
- 1615 Stardance Cir
- 265 High Point Dr Unit 201
- 265 High Point Dr Unit 203
- 265 High Point Dr Unit 207
- 631 Buchanan Ln
- 1556 Stardance Cir
- 235 High Point Dr Unit 206
- 756 Brookside Dr
- 210 High Point Dr
- 218 High Point Dr
- 741 Elliott St
- 160 High Point Dr
- Stanford Plan at Highlands at Fox Hill - The Flats
- Timberline Plan at Highlands at Fox Hill - Discovery
- Syracuse Plan at Highlands at Fox Hill - The Flats