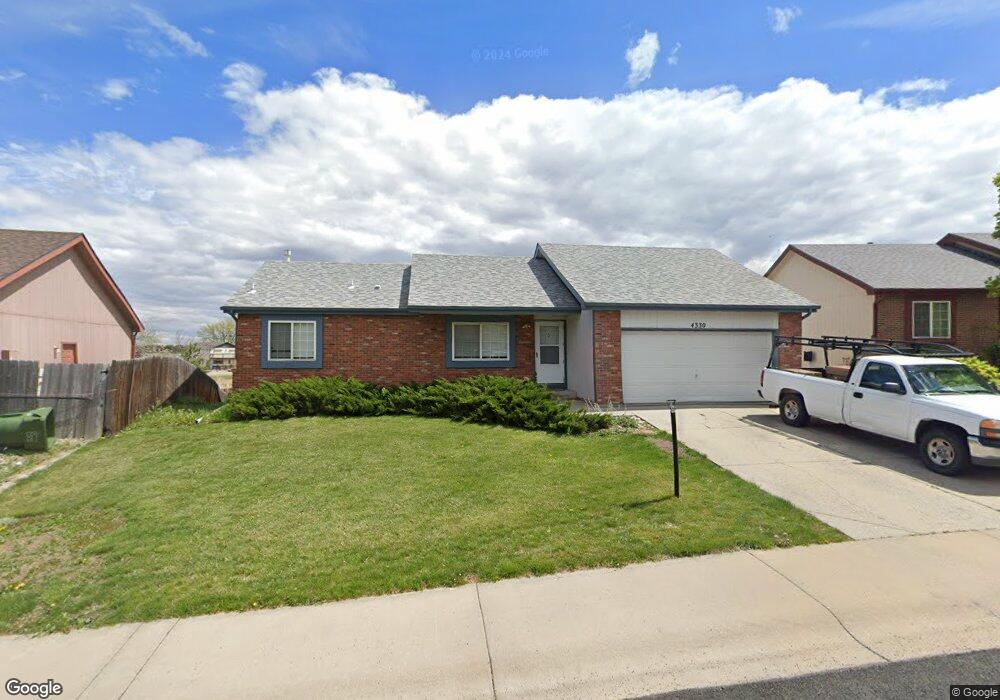
4330 Sunridge Dr Loveland, CO 80538
Estimated Value: $428,231 - $444,000
3
Beds
2
Baths
1,077
Sq Ft
$404/Sq Ft
Est. Value
About This Home
This home is located at 4330 Sunridge Dr, Loveland, CO 80538 and is currently estimated at $435,308, approximately $404 per square foot. 4330 Sunridge Dr is a home located in Larimer County with nearby schools including Peakview Academy at Conrad Ball, Stansberry Elementary School, and Mountain View High School.
Ownership History
Date
Name
Owned For
Owner Type
Purchase Details
Closed on
Aug 31, 2020
Sold by
Boland Daniel W and Boland Janet L
Bought by
Boland Mark W and Boland Katie M
Current Estimated Value
Home Financials for this Owner
Home Financials are based on the most recent Mortgage that was taken out on this home.
Original Mortgage
$223,507
Outstanding Balance
$198,348
Interest Rate
2.9%
Mortgage Type
New Conventional
Estimated Equity
$236,960
Purchase Details
Closed on
Jun 13, 2002
Sold by
Klein Dola J
Bought by
Boland Daniel W and Boland Janet L
Purchase Details
Closed on
May 1, 1994
Sold by
Boehner Dale
Bought by
Orcas Development Llc
Purchase Details
Closed on
Oct 1, 1993
Sold by
Giuliano & Father Construction Inc
Bought by
Klein Dola J
Purchase Details
Closed on
Jan 1, 1993
Sold by
Norwest Bank Ftc Na
Bought by
Francis Realty Inc Profit Sharing
Create a Home Valuation Report for This Property
The Home Valuation Report is an in-depth analysis detailing your home's value as well as a comparison with similar homes in the area
Home Values in the Area
Average Home Value in this Area
Purchase History
| Date | Buyer | Sale Price | Title Company |
|---|---|---|---|
| Boland Mark W | $279,384 | Land Title Guarantee | |
| Boland Daniel W | $181,000 | Land Title Guarantee Company | |
| Orcas Development Llc | -- | -- | |
| Klein Dola J | $91,200 | -- | |
| Francis Realty Inc Profit Sharing | -- | -- |
Source: Public Records
Mortgage History
| Date | Status | Borrower | Loan Amount |
|---|---|---|---|
| Open | Boland Mark W | $223,507 |
Source: Public Records
Tax History Compared to Growth
Tax History
| Year | Tax Paid | Tax Assessment Tax Assessment Total Assessment is a certain percentage of the fair market value that is determined by local assessors to be the total taxable value of land and additions on the property. | Land | Improvement |
|---|---|---|---|---|
| 2025 | $2,130 | $30,371 | $1,548 | $28,823 |
| 2024 | $2,054 | $30,371 | $1,548 | $28,823 |
| 2022 | $1,805 | $22,684 | $1,605 | $21,079 |
| 2021 | $1,855 | $23,338 | $1,652 | $21,686 |
| 2020 | $1,726 | $21,708 | $1,652 | $20,056 |
| 2019 | $1,697 | $21,708 | $1,652 | $20,056 |
| 2018 | $1,475 | $17,921 | $1,663 | $16,258 |
| 2017 | $1,270 | $17,921 | $1,663 | $16,258 |
| 2016 | $1,192 | $16,255 | $1,839 | $14,416 |
| 2015 | $1,182 | $16,260 | $1,840 | $14,420 |
| 2014 | $1,036 | $13,780 | $1,840 | $11,940 |
Source: Public Records
Map
Nearby Homes
- 4342 Sunridge Dr
- 4386 Suncreek Dr
- 584 Sunwood Dr
- 4453 N Lincoln Ave
- 324 Sagewood Dr
- 171 E 42nd St Unit C
- 119 E 42nd St Unit 3B
- 4789 Sunvalley Dr
- 126 Juniper Place
- 127 Juniper Place
- 138 Juniper Place
- 132 W 47th Place Unit 1
- 307 Juniper Place
- 4105 N Garfield Ave Unit 100
- 4105 N Garfield Ave Unit 61
- 204 E 50th St
- 4868 Harrison Ave
- 4869 Roosevelt Ave
- 3402 White Ash Ct
- 3244 Hawthorn Dr
- 4334 Sunridge Dr
- 4326 Sunridge Dr
- 4338 Sunridge Dr
- 4322 Sunridge Dr
- 4333 Sunridge Dr
- 4339 Sunridge Dr
- 4243 Peach Tree Ct
- 4251 Peach Tree Ct
- 4235 Peach Tree Ct
- 4327 Sunridge Dr
- 4259 Peach Tree Ct
- 4345 Sunridge Dr
- 4318 Sunridge Dr
- 4267 Peach Tree Ct
- 4227 Peach Tree Ct
- 4321 Sunridge Dr
- 4275 Peach Tree Ct
- 4346 Sunridge Dr
- 4364 Suncreek Dr
- 4351 Sunridge Dr