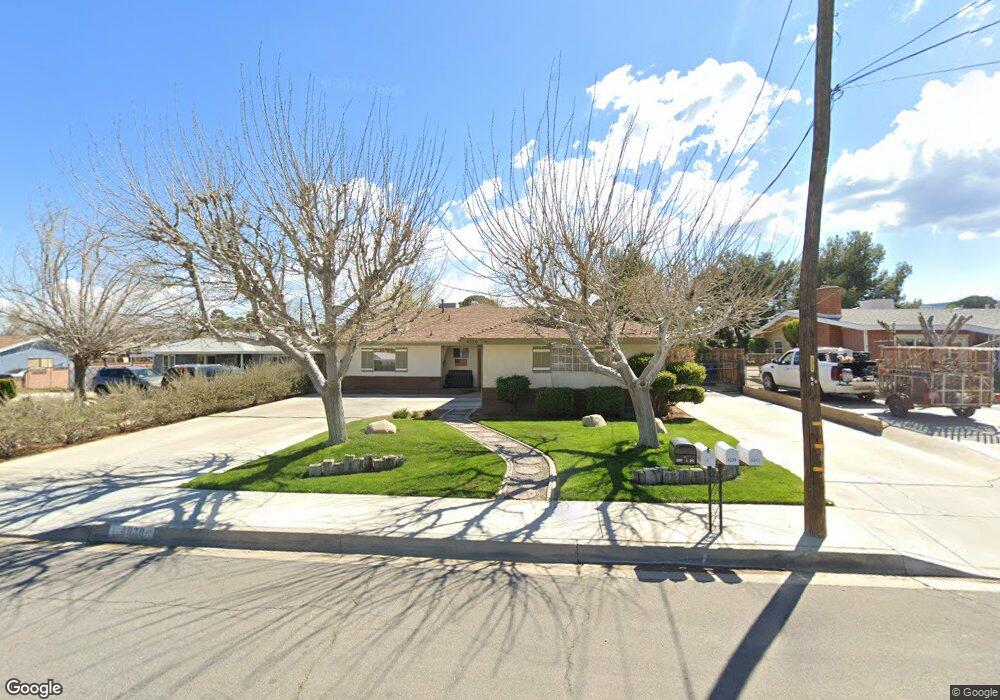
4330 W Avenue l4 Lancaster, CA 93536
Quartz Hill NeighborhoodEstimated Value: $539,000 - $609,000
3
Beds
3
Baths
2,259
Sq Ft
$252/Sq Ft
Est. Value
About This Home
This home is located at 4330 W Avenue l4, Lancaster, CA 93536 and is currently estimated at $568,173, approximately $251 per square foot. 4330 W Avenue l4 is a home located in Los Angeles County with nearby schools including Valley View Elementary School, Joe Walker Middle School, and Lancaster High School.
Ownership History
Date
Name
Owned For
Owner Type
Purchase Details
Closed on
Aug 22, 2017
Sold by
Maronski Shannon
Bought by
Maronski Frank
Current Estimated Value
Purchase Details
Closed on
Nov 18, 2004
Sold by
Maronski Frank and Maronski Shannon
Bought by
Maronski Frank and Maronski Shannon
Home Financials for this Owner
Home Financials are based on the most recent Mortgage that was taken out on this home.
Original Mortgage
$220,000
Outstanding Balance
$108,835
Interest Rate
5.65%
Mortgage Type
New Conventional
Estimated Equity
$459,338
Purchase Details
Closed on
Jul 13, 1998
Sold by
Krueger Norman And Linda Trs
Bought by
Maronski Frank and Maronski Shannon
Home Financials for this Owner
Home Financials are based on the most recent Mortgage that was taken out on this home.
Original Mortgage
$132,050
Interest Rate
6.95%
Purchase Details
Closed on
Oct 19, 1993
Sold by
Krueger Norman L and Krueger Linda Mae
Bought by
Krueger Norman Lester and Krueger Linda Mae
Create a Home Valuation Report for This Property
The Home Valuation Report is an in-depth analysis detailing your home's value as well as a comparison with similar homes in the area
Home Values in the Area
Average Home Value in this Area
Purchase History
| Date | Buyer | Sale Price | Title Company |
|---|---|---|---|
| Maronski Frank | -- | None Available | |
| Maronski Frank | -- | First American Title Company | |
| Maronski Frank | $139,000 | Chicago Title | |
| Krueger Norman Lester | -- | -- |
Source: Public Records
Mortgage History
| Date | Status | Borrower | Loan Amount |
|---|---|---|---|
| Open | Maronski Frank | $220,000 | |
| Closed | Maronski Frank | $132,050 |
Source: Public Records
Tax History Compared to Growth
Tax History
| Year | Tax Paid | Tax Assessment Tax Assessment Total Assessment is a certain percentage of the fair market value that is determined by local assessors to be the total taxable value of land and additions on the property. | Land | Improvement |
|---|---|---|---|---|
| 2025 | $4,479 | $312,688 | $47,019 | $265,669 |
| 2024 | $4,479 | $306,558 | $46,098 | $260,460 |
| 2023 | $4,445 | $300,548 | $45,195 | $255,353 |
| 2022 | $4,375 | $294,656 | $44,309 | $250,347 |
| 2021 | $4,301 | $288,880 | $43,441 | $245,439 |
| 2019 | $4,194 | $280,313 | $42,153 | $238,160 |
| 2018 | $4,139 | $274,818 | $41,327 | $233,491 |
| 2016 | $3,915 | $264,148 | $39,723 | $224,425 |
| 2015 | $3,759 | $251,000 | $37,700 | $213,300 |
| 2014 | $3,441 | $221,000 | $33,200 | $187,800 |
Source: Public Records
Map
Nearby Homes
- 4330 Avenue L 2
- 4330 W Avenue l2
- 4257 W Avenue l6
- 4541 W Avenue l2
- 42434 Blossom Dr
- 42524 42nd St W
- 42628 47th St W
- 4315 Serene Ave
- 42346 47th St W
- 4554 Meadow Place
- 4302 Olivera Place
- 4015 W Avenue l2
- 4748 W Avenue L
- 0 W Cor 40th Stw Pav St Unit K1 25006120
- 4741 W Avenue L
- 42232 42nd St W
- 4147 Glacier Place
- 4309 W Avenue k12
- 4742 W Avenue l12
- 0 W Unit 25005626
- 4326 W Avenue l4
- 4340 W Avenue l4
- 4318 W Avenue l4
- 4344 W Avenue l4
- 4344 W Ave L-4
- 4333 W Avenue l4
- 4308 W Avenue l4
- 4325 W Avenue l4
- 4352 W Avenue l4
- 4345 W Avenue l4
- 4325 W Avenue L 4
- 4311 W Avenue l4
- 4302 W Avenue l4
- 4358 W Avenue l4
- 4339 W Avenue l4
- 4300 W Avenue l4
- 4357 W Avenue l4
- 0 Avenue L4 Vic 45th Stw Unit 21002881
- 4260 W Avenue l4
- 4259 W Avenue l4