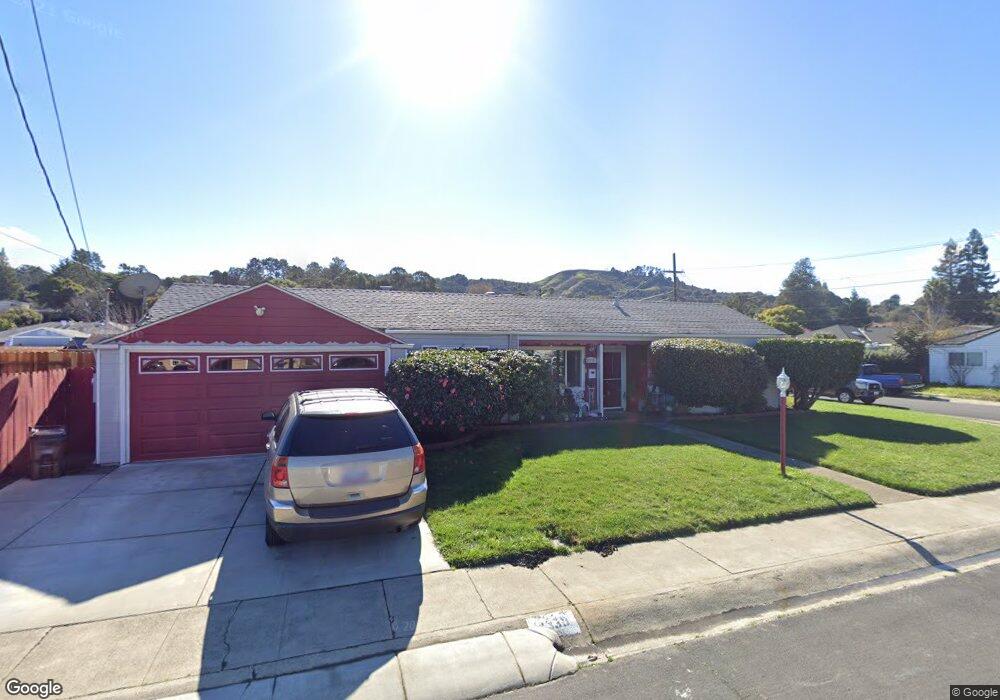
4330 Wesley Way El Sobrante, CA 94803
Estimated Value: $558,000 - $606,000
2
Beds
1
Bath
1,026
Sq Ft
$559/Sq Ft
Est. Value
About This Home
This home is located at 4330 Wesley Way, El Sobrante, CA 94803 and is currently estimated at $573,662, approximately $559 per square foot. 4330 Wesley Way is a home located in Contra Costa County with nearby schools including Sheldon Elementary School, Betty Reid Soskin Middle School, and De Anza Senior High School.
Ownership History
Date
Name
Owned For
Owner Type
Purchase Details
Closed on
Mar 15, 2013
Sold by
Thomas Jimmie and Givens Thomas Sonja F
Bought by
Givens Thomas Sonja F and Thomas Jimmie
Current Estimated Value
Home Financials for this Owner
Home Financials are based on the most recent Mortgage that was taken out on this home.
Original Mortgage
$190,300
Outstanding Balance
$37,437
Interest Rate
3.34%
Mortgage Type
New Conventional
Estimated Equity
$536,225
Purchase Details
Closed on
Feb 21, 2013
Sold by
Thomas Jimmie and Givens Thomas Sonja F
Bought by
Thomas Jimmie and Givens Thomas Sonja F
Home Financials for this Owner
Home Financials are based on the most recent Mortgage that was taken out on this home.
Original Mortgage
$190,300
Outstanding Balance
$37,437
Interest Rate
3.34%
Mortgage Type
New Conventional
Estimated Equity
$536,225
Purchase Details
Closed on
Sep 27, 1994
Sold by
Shanks Paul W and Shanks Vicki J
Bought by
Thomas Jimmie and Givens Sonja F
Home Financials for this Owner
Home Financials are based on the most recent Mortgage that was taken out on this home.
Original Mortgage
$138,651
Interest Rate
8.55%
Mortgage Type
FHA
Create a Home Valuation Report for This Property
The Home Valuation Report is an in-depth analysis detailing your home's value as well as a comparison with similar homes in the area
Home Values in the Area
Average Home Value in this Area
Purchase History
| Date | Buyer | Sale Price | Title Company |
|---|---|---|---|
| Givens Thomas Sonja F | -- | None Available | |
| Thomas Jimmie | -- | Title Source | |
| Thomas Jimmie | $140,000 | North American Title Company |
Source: Public Records
Mortgage History
| Date | Status | Borrower | Loan Amount |
|---|---|---|---|
| Open | Thomas Jimmie | $190,300 | |
| Closed | Thomas Jimmie | $138,651 |
Source: Public Records
Tax History Compared to Growth
Tax History
| Year | Tax Paid | Tax Assessment Tax Assessment Total Assessment is a certain percentage of the fair market value that is determined by local assessors to be the total taxable value of land and additions on the property. | Land | Improvement |
|---|---|---|---|---|
| 2025 | $4,032 | $235,122 | $142,757 | $92,365 |
| 2024 | $3,935 | $230,512 | $139,958 | $90,554 |
| 2023 | $3,935 | $225,993 | $137,214 | $88,779 |
| 2022 | $3,865 | $221,563 | $134,524 | $87,039 |
| 2021 | $3,829 | $217,220 | $131,887 | $85,333 |
| 2019 | $3,625 | $210,779 | $127,976 | $82,803 |
| 2018 | $3,471 | $206,647 | $125,467 | $81,180 |
| 2017 | $3,368 | $202,596 | $123,007 | $79,589 |
| 2016 | $3,297 | $198,625 | $120,596 | $78,029 |
| 2015 | $3,261 | $195,642 | $118,785 | $76,857 |
| 2014 | $3,234 | $191,811 | $116,459 | $75,352 |
Source: Public Records
Map
Nearby Homes
- 4370 Wesley Way
- 4441 Jana Vista Rd
- 4616 Elmwood Rd
- 4556 Appian Way Unit 36
- 4556 Appian Way Unit 12
- 4022 San Pablo Dam Rd
- 4091 Garden Rd
- 435 Colina Way
- 3944 La Cima Rd
- 2154 Pyramid Dr
- 476 Colina Way
- 4623 Appian Way
- 4428 Santa Rita Rd
- 4044 Lambert Rd
- 2835 Stephen Dr
- 2448 Diane Dr
- 130 Creekside Ct
- 4047 Mozart Dr
- 3760 Via Verdi
- 3764 Via Verdi Unit 13
- 3910 Charles Ave
- 4344 Wesley Way
- 3918 Charles Ave
- 4331 Wesley Way
- 4339 Wesley Way
- 4354 Wesley Way
- 4323 Wesley Way
- 4331 Bermar Ave
- 4347 Bermar Ave
- 4347 Wesley Way
- 4300 Wesley Way
- 3911 Charles Ave
- 4313 Wesley Way
- 4355 Wesley Way
- 4355 Bermar Ave
- 3919 Charles Ave
- 4362 Wesley Way
- 3927 Charles Ave
- 4363 Wesley Way
- 4305 Wesley Way