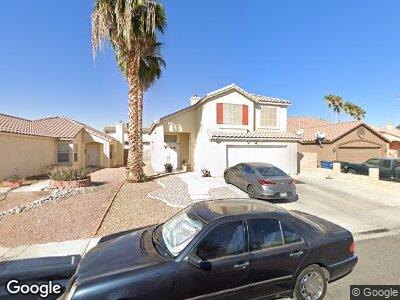
4331 Chessman Way Las Vegas, NV 89147
Spring Valley NeighborhoodEstimated Value: $441,248 - $483,000
4
Beds
3
Baths
1,844
Sq Ft
$252/Sq Ft
Est. Value
About This Home
This home is located at 4331 Chessman Way, Las Vegas, NV 89147 and is currently estimated at $463,812, approximately $251 per square foot. 4331 Chessman Way is a home located in Clark County with nearby schools including Pat Diskin Elementary School, Clifford J Lawrence Junior High School, and Spring Valley High School.
Ownership History
Date
Name
Owned For
Owner Type
Purchase Details
Closed on
Sep 2, 2005
Sold by
Nieh Tsai Fang
Bought by
Hernandez Reynaldo and Hernandez Flor De Maria
Current Estimated Value
Home Financials for this Owner
Home Financials are based on the most recent Mortgage that was taken out on this home.
Original Mortgage
$227,500
Interest Rate
6.47%
Mortgage Type
Unknown
Purchase Details
Closed on
Jul 22, 2004
Sold by
Mcbribe Sean S
Bought by
Nieh Tsai Fang
Purchase Details
Closed on
Jan 19, 2000
Sold by
Valero Ernesto A and Valero Emilia B
Bought by
Mcbride Sean S and Nieh Tsai Fang
Purchase Details
Closed on
Sep 23, 1994
Sold by
Pardee Construction Company Of Nevada
Bought by
Valero Ernesto A and Valero Emilia B
Home Financials for this Owner
Home Financials are based on the most recent Mortgage that was taken out on this home.
Original Mortgage
$135,651
Interest Rate
8.58%
Mortgage Type
VA
Create a Home Valuation Report for This Property
The Home Valuation Report is an in-depth analysis detailing your home's value as well as a comparison with similar homes in the area
Home Values in the Area
Average Home Value in this Area
Purchase History
| Date | Buyer | Sale Price | Title Company |
|---|---|---|---|
| Hernandez Reynaldo | $325,000 | Community Title | |
| Nieh Tsai Fang | -- | Community Title | |
| Nieh Tsai Fang | -- | -- | |
| Mcbride Sean S | $136,253 | Lawyers Title | |
| Valero Ernesto A | $132,000 | United Title |
Source: Public Records
Mortgage History
| Date | Status | Borrower | Loan Amount |
|---|---|---|---|
| Open | Hernandez Reyanldo | $381,203 | |
| Closed | Hernandez Reynaldo | $254,000 | |
| Closed | Hernandez Reynaldo | $227,500 | |
| Previous Owner | Valero Ernesto A | $135,651 |
Source: Public Records
Tax History Compared to Growth
Tax History
| Year | Tax Paid | Tax Assessment Tax Assessment Total Assessment is a certain percentage of the fair market value that is determined by local assessors to be the total taxable value of land and additions on the property. | Land | Improvement |
|---|---|---|---|---|
| 2025 | $2,096 | $96,650 | $37,450 | $59,200 |
| 2024 | $1,941 | $96,650 | $37,450 | $59,200 |
| 2023 | $1,941 | $89,957 | $33,600 | $56,357 |
| 2022 | $1,798 | $79,018 | $27,300 | $51,718 |
| 2021 | $1,665 | $72,416 | $23,100 | $49,316 |
| 2020 | $1,543 | $71,082 | $22,050 | $49,032 |
| 2019 | $1,446 | $68,714 | $20,300 | $48,414 |
| 2018 | $1,380 | $63,977 | $17,500 | $46,477 |
| 2017 | $1,856 | $63,301 | $16,100 | $47,201 |
| 2016 | $1,293 | $61,361 | $12,950 | $48,411 |
| 2015 | $1,289 | $53,079 | $9,100 | $43,979 |
| 2014 | $1,249 | $45,274 | $5,950 | $39,324 |
Source: Public Records
Map
Nearby Homes
- 7324 Empress Dr
- 4419 Fairmont Cir
- 7123 Kenwood St
- 7285 Pinebrook Cir
- 7229 Pinebrook Cir
- 7274 Pinebrook Cir
- 7098 Forest Vista St
- 4194 Greenpoint St
- 4302 Newhaven Dr
- 7328 Coffeyville Ave
- 4322 Satinwood Dr Unit 9
- 7176 Fenway Ave
- 4669 Winfield Dr
- 7341 Girard Dr
- 7400 W Flamingo Rd Unit 1090
- 7400 W Flamingo Rd Unit 1003
- 7400 W Flamingo Rd Unit 1087
- 7400 W Flamingo Rd Unit 2058
- 7400 W Flamingo Rd Unit 2022
- 7400 W Flamingo Rd Unit 2013
- 4331 Chessman Way
- 4337 Chessman Way Unit none
- 4337 Chessman Way
- 4327 Chessman Way
- 4343 Chessman Way
- 4343 Chessman Way Unit home
- 4343 Chessman Way Unit house
- 4343 Chessman Way Unit n/a
- 4326 Sunnyview Ct
- 4334 Sunnyview Ct
- 4349 Chessman Way
- 7227 Galley Dr Unit 6A
- 4320 Sunnyview Ct
- 7254 Galley Dr
- 4334 Chessman Way
- 4340 Chessman Way
- 4357 Chessman Way
- 7246 Galley Dr
- 7219 Galley Dr
- 4312 Sunnyview Ct