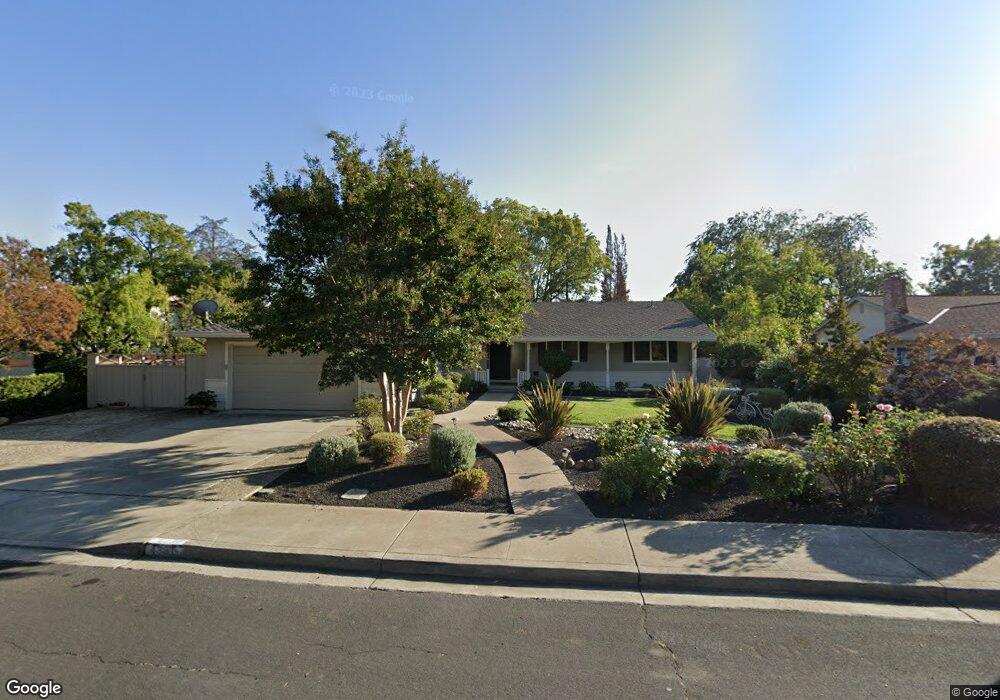
4331 Findlay Way Livermore, CA 94550
Jensen NeighborhoodEstimated Value: $1,051,205 - $1,380,000
4
Beds
2
Baths
1,721
Sq Ft
$713/Sq Ft
Est. Value
About This Home
This home is located at 4331 Findlay Way, Livermore, CA 94550 and is currently estimated at $1,226,301, approximately $712 per square foot. 4331 Findlay Way is a home located in Alameda County with nearby schools including Jackson Avenue Elementary School, East Avenue Middle School, and Livermore High School.
Ownership History
Date
Name
Owned For
Owner Type
Purchase Details
Closed on
May 28, 2020
Sold by
Zocca Mary
Bought by
Zocca Mary and The Mary Zocca Separate Proper
Current Estimated Value
Purchase Details
Closed on
Dec 10, 2013
Sold by
Cigliuti Emil P and The Cigliuti 1999 Family Trust
Bought by
Zocca Mary
Home Financials for this Owner
Home Financials are based on the most recent Mortgage that was taken out on this home.
Original Mortgage
$295,000
Outstanding Balance
$219,005
Interest Rate
4.04%
Mortgage Type
New Conventional
Estimated Equity
$1,007,296
Purchase Details
Closed on
Nov 25, 2013
Sold by
Zocca Raffaele
Bought by
Zocca Mary
Home Financials for this Owner
Home Financials are based on the most recent Mortgage that was taken out on this home.
Original Mortgage
$295,000
Outstanding Balance
$219,005
Interest Rate
4.04%
Mortgage Type
New Conventional
Estimated Equity
$1,007,296
Purchase Details
Closed on
Mar 1, 1999
Sold by
Cigliuti Emil P and Cigliuti Patricia A
Bought by
Cigliuti Emil P and Cigliuti Patricia A
Create a Home Valuation Report for This Property
The Home Valuation Report is an in-depth analysis detailing your home's value as well as a comparison with similar homes in the area
Home Values in the Area
Average Home Value in this Area
Purchase History
| Date | Buyer | Sale Price | Title Company |
|---|---|---|---|
| Zocca Mary | -- | None Available | |
| Zocca Mary | $645,000 | Chicago Title Company | |
| Zocca Mary | -- | Chicago Title Company | |
| Cigliuti Emil P | -- | -- | |
| Cigliuti Emil P | -- | -- |
Source: Public Records
Mortgage History
| Date | Status | Borrower | Loan Amount |
|---|---|---|---|
| Open | Zocca Mary | $295,000 |
Source: Public Records
Tax History
| Year | Tax Paid | Tax Assessment Tax Assessment Total Assessment is a certain percentage of the fair market value that is determined by local assessors to be the total taxable value of land and additions on the property. | Land | Improvement |
|---|---|---|---|---|
| 2025 | $2,146 | $89,832 | $24,485 | $72,347 |
| 2024 | $2,146 | $87,933 | $24,005 | $70,928 |
| 2023 | $2,089 | $93,073 | $23,535 | $69,538 |
| 2022 | $2,116 | $91,248 | $23,073 | $68,175 |
| 2021 | $1,314 | $89,459 | $22,621 | $66,838 |
| 2020 | $1,978 | $88,542 | $22,389 | $66,153 |
| 2019 | $1,968 | $86,806 | $21,950 | $64,856 |
| 2018 | $1,904 | $85,105 | $21,520 | $63,585 |
| 2017 | $1,757 | $83,436 | $21,098 | $62,338 |
| 2016 | $1,663 | $81,800 | $20,684 | $61,116 |
| 2015 | $1,573 | $80,572 | $20,374 | $60,198 |
| 2014 | $1,539 | $78,994 | $19,975 | $59,019 |
Source: Public Records
Map
Nearby Homes
- 1368 Pegan Common
- 3910 East Ave
- 1215 S Livermore Ave
- 3992 Yale Way
- 3734 Carrigan Common
- 317 Hillcrest Ave
- 2599 Cooper Cir
- 865 Bower Ct
- 3965 Purdue Way
- 3959 Purdue Way
- 5218 Norma Way
- 5408 Stockton Loop
- 5287 Diane Ln
- 337 Chris Common Unit 111
- 5143 Tesla Rd
- 5590 Hopps Ln
- 2535 Kellogg Loop
- 2772 San Minete Dr
- 2660 Covey Way
- 4844 Mulqueeney Common
- 4319 Findlay Way
- 4347 Findlay Way
- 4332 Guilford Ave
- 4316 Guilford Ave
- 4340 Guilford Ave
- 4265 Findlay Way
- 4353 Findlay Way
- 4256 Guilford Ave
- 4354 Guilford Ave
- 4333 Emory Way
- 4257 Findlay Way
- 4311 Emory Way
- 1325 Madison Ave
- 4240 Guilford Ave
- 4355 Emory Way
- 4368 Guilford Ave
- 4259 Emory Way
- 4329 Guilford Ave
- 4345 Guilford Ave
- 4313 Guilford Ave