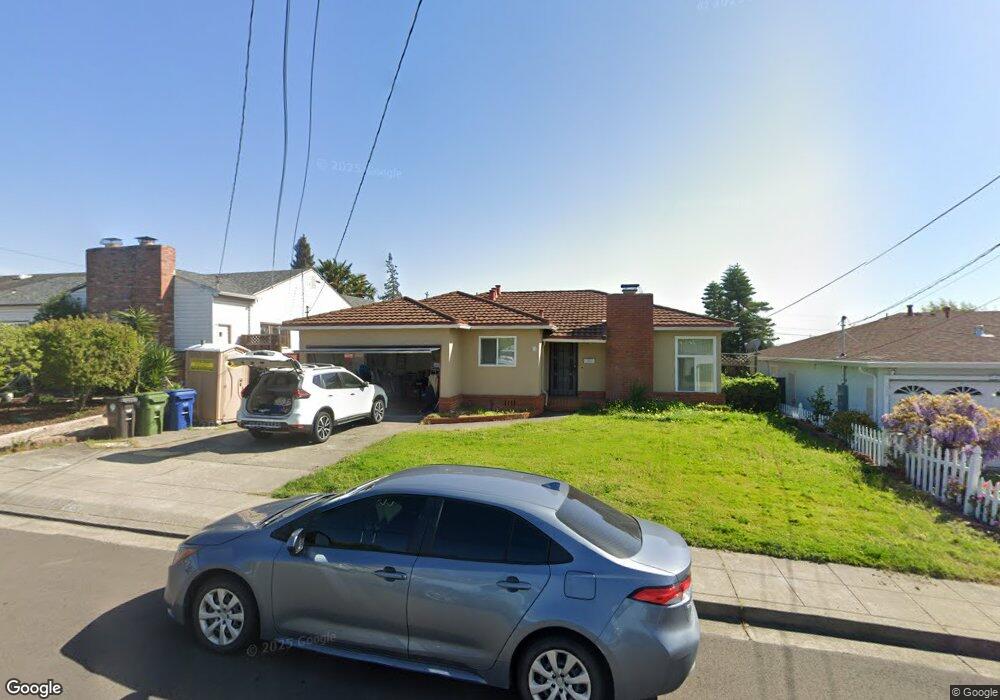
4331 Shamrock Way Castro Valley, CA 94546
Castro Valley East NeighborhoodEstimated Value: $986,000 - $1,168,000
3
Beds
2
Baths
1,145
Sq Ft
$923/Sq Ft
Est. Value
About This Home
This home is located at 4331 Shamrock Way, Castro Valley, CA 94546 and is currently estimated at $1,056,483, approximately $922 per square foot. 4331 Shamrock Way is a home located in Alameda County with nearby schools including Marshall Elementary School, Creekside Middle School, and Canyon Middle School.
Ownership History
Date
Name
Owned For
Owner Type
Purchase Details
Closed on
Sep 3, 2014
Sold by
Hwang Techen and Liang Min Fang
Bought by
Hwang Techen and Liang Min Fang
Current Estimated Value
Home Financials for this Owner
Home Financials are based on the most recent Mortgage that was taken out on this home.
Original Mortgage
$370,000
Outstanding Balance
$282,735
Interest Rate
4.09%
Mortgage Type
New Conventional
Estimated Equity
$773,748
Purchase Details
Closed on
Aug 24, 2013
Sold by
Shaw Steve J and Shaw Jo Ann L
Bought by
Hwang Techen and Liang Min Fang
Home Financials for this Owner
Home Financials are based on the most recent Mortgage that was taken out on this home.
Original Mortgage
$379,000
Interest Rate
4.33%
Mortgage Type
New Conventional
Purchase Details
Closed on
Jan 11, 1996
Sold by
Santos Raymond B and Santos Beatrice
Bought by
Shaw Steven J and Shaw Jo Ann L
Home Financials for this Owner
Home Financials are based on the most recent Mortgage that was taken out on this home.
Original Mortgage
$182,850
Interest Rate
7.38%
Create a Home Valuation Report for This Property
The Home Valuation Report is an in-depth analysis detailing your home's value as well as a comparison with similar homes in the area
Home Values in the Area
Average Home Value in this Area
Purchase History
| Date | Buyer | Sale Price | Title Company |
|---|---|---|---|
| Hwang Techen | -- | First American Title Company | |
| Hwang Techen | $526,000 | Stewart Title Of California | |
| Shaw Steven J | $192,500 | Golden California Title |
Source: Public Records
Mortgage History
| Date | Status | Borrower | Loan Amount |
|---|---|---|---|
| Open | Hwang Techen | $370,000 | |
| Closed | Hwang Techen | $379,000 | |
| Previous Owner | Shaw Steven J | $182,850 |
Source: Public Records
Tax History
| Year | Tax Paid | Tax Assessment Tax Assessment Total Assessment is a certain percentage of the fair market value that is determined by local assessors to be the total taxable value of land and additions on the property. | Land | Improvement |
|---|---|---|---|---|
| 2025 | $8,288 | $644,775 | $193,432 | $451,343 |
| 2024 | $8,288 | $632,135 | $189,640 | $442,495 |
| 2023 | $8,152 | $619,743 | $185,923 | $433,820 |
| 2022 | $7,994 | $607,592 | $182,277 | $425,315 |
| 2021 | $7,789 | $595,684 | $178,705 | $416,979 |
| 2020 | $7,612 | $589,577 | $176,873 | $412,704 |
| 2019 | $7,751 | $578,020 | $173,406 | $404,614 |
| 2018 | $7,532 | $566,690 | $170,007 | $396,683 |
| 2017 | $7,335 | $555,581 | $166,674 | $388,907 |
| 2016 | $6,981 | $544,688 | $163,406 | $381,282 |
| 2015 | $6,525 | $536,508 | $160,952 | $375,556 |
| 2014 | $6,447 | $526,000 | $157,800 | $368,200 |
Source: Public Records
Map
Nearby Homes
- 19430 Center St
- 19554 Alana Rd
- 4513 Heyer Ave
- 19901 Forest Ave
- 4119 Ravenwood Place
- 4827 Roberts Ct
- 3998 Castro Valley Blvd Unit 34
- 20255 Yeandle Ave
- 3824 Norbridge Ave
- 3775 Castro Valley Blvd
- 3769 Castro Valley Blvd
- 3767 Castro Valley Blvd
- 3836 Norbridge Ave
- 21063 Story St
- 3822 Norbridge Ave
- 3818 Norbridge Ave
- 4937 Crow Canyon Rd
- 0 Jensen Rd Unit 41089385
- 3642 Lorena Ave
- 3630 Lorena Ave
- 4325 Shamrock Way
- 4337 Shamrock Way
- 4328 Circle Ave
- 4334 Circle Ave
- 4343 Shamrock Way
- 4322 Circle Ave
- 4338 Circle Ave
- 4332 Shamrock Way
- 4338 Shamrock Way
- 4326 Shamrock Way
- 4318 Circle Ave
- 4313 Shamrock Way
- 4349 Shamrock Way
- 4320 Shamrock Way
- 4344 Shamrock Way
- 4312 Circle Ave
- 4307 Shamrock Way
- 4327 Circle Ave
- 4350 Shamrock Way
- 4355 Shamrock Way
Your Personal Tour Guide
Ask me questions while you tour the home.