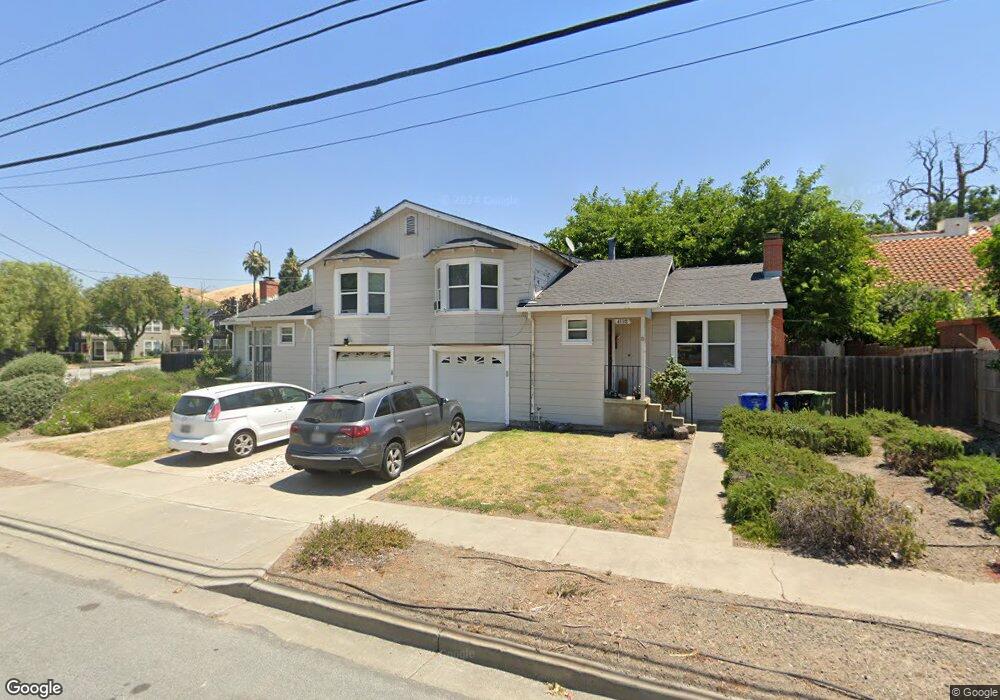
43318 Bryant St Fremont, CA 94539
Mission San Jose NeighborhoodEstimated Value: $2,219,157 - $2,798,000
4
Beds
2
Baths
1,703
Sq Ft
$1,449/Sq Ft
Est. Value
About This Home
This home is located at 43318 Bryant St, Fremont, CA 94539 and is currently estimated at $2,467,539, approximately $1,448 per square foot. 43318 Bryant St is a home located in Alameda County with nearby schools including Mission San Jose Elementary School, William Hopkins Junior High School, and Mission San Jose High School.
Ownership History
Date
Name
Owned For
Owner Type
Purchase Details
Closed on
May 19, 2016
Sold by
Luo Jingharng and Liang Ksai
Bought by
Luo Jingharng Gene and Liang Ksai
Current Estimated Value
Purchase Details
Closed on
Mar 26, 2013
Sold by
Koo Michael Changsheng
Bought by
Koo Michael Changsheng and Luo Jinghang
Purchase Details
Closed on
Dec 20, 2012
Sold by
Liang Ksai
Bought by
Luo Jingharng
Purchase Details
Closed on
Dec 29, 2008
Sold by
Koo Michael Chang Sheng
Bought by
Koo Michael Chang Sheng and Luo Jingharng
Home Financials for this Owner
Home Financials are based on the most recent Mortgage that was taken out on this home.
Original Mortgage
$533,850
Interest Rate
6.1%
Mortgage Type
Purchase Money Mortgage
Purchase Details
Closed on
Dec 23, 2008
Sold by
Westendorf Harald and Mary J Dean Living Trust
Bought by
Koo Michale Chang Sheng
Home Financials for this Owner
Home Financials are based on the most recent Mortgage that was taken out on this home.
Original Mortgage
$533,850
Interest Rate
6.1%
Mortgage Type
Purchase Money Mortgage
Purchase Details
Closed on
Jun 15, 2008
Sold by
Dean Mary J
Bought by
Dean Mary J and Mary J Dean Living Trust
Create a Home Valuation Report for This Property
The Home Valuation Report is an in-depth analysis detailing your home's value as well as a comparison with similar homes in the area
Home Values in the Area
Average Home Value in this Area
Purchase History
| Date | Buyer | Sale Price | Title Company |
|---|---|---|---|
| Luo Jingharng Gene | -- | None Available | |
| Koo Michael Changsheng | -- | None Available | |
| Luo Jingharng | -- | Fidelity National Title Co | |
| Koo Michael Chang Sheng | -- | None Available | |
| Koo Michale Chang Sheng | $884,500 | Fidelity National Title Co | |
| Dean Mary J | -- | None Available |
Source: Public Records
Mortgage History
| Date | Status | Borrower | Loan Amount |
|---|---|---|---|
| Previous Owner | Koo Michale Chang Sheng | $533,850 |
Source: Public Records
Tax History Compared to Growth
Tax History
| Year | Tax Paid | Tax Assessment Tax Assessment Total Assessment is a certain percentage of the fair market value that is determined by local assessors to be the total taxable value of land and additions on the property. | Land | Improvement |
|---|---|---|---|---|
| 2025 | $17,530 | $1,456,396 | $625,795 | $830,601 |
| 2024 | $17,530 | $1,427,840 | $613,525 | $814,315 |
| 2023 | $17,059 | $1,399,845 | $601,496 | $798,349 |
| 2022 | $16,837 | $1,372,402 | $589,704 | $782,698 |
| 2021 | $16,436 | $1,345,497 | $578,143 | $767,354 |
| 2020 | $16,456 | $1,331,712 | $572,220 | $759,492 |
| 2019 | $16,268 | $1,305,600 | $561,000 | $744,600 |
| 2018 | $12,432 | $979,402 | $293,792 | $685,610 |
| 2017 | $12,121 | $960,199 | $288,032 | $672,167 |
| 2016 | $11,917 | $941,376 | $282,385 | $658,991 |
| 2015 | $11,765 | $927,242 | $278,146 | $649,096 |
| 2014 | $11,572 | $909,082 | $272,698 | $636,384 |
Source: Public Records
Map
Nearby Homes
- 43382 Bryant St
- 341 Dana St
- 43547 Ellsworth St
- 42965 Corte Verde
- 42955 Corte Verde
- 138 Telles Ln
- 335 Via Rosario
- 483 Becado Place
- 463 Becado Place
- 124 Linmore Dr
- 905 Glenhill Dr
- 646 Bella Vista Ct
- 42099 Vinha Way
- 41997 Via San Gabriel
- 600 Praderia Cir
- 1873 Berry Ct
- 2164 Ocaso Camino
- 379 Felipe Common
- 42329 Troyer Ave
- 2225 Valorie St
- 43316 Bryant St
- 43334 Bryant St
- 306 Escobar St
- 43342 Bryant St
- 270 Washington Blvd
- 312 Escobar St
- 43347 Ellsworth St Unit ADU In Law Unit
- 43347 Ellsworth St Unit A1 Bottom floor
- 43347 Ellsworth St Unit Back
- 43347 Ellsworth St Unit A1
- 43347 Ellsworth St
- 301 Ohlones St
- 43353 Ellsworth St
- 318 Escobar St
- 43362 Bryant St
- 323 Escobar St
- 303 Ohlones St
- 43365 Ellsworth St
- 43376 Bryant St
- 332 Washington Blvd