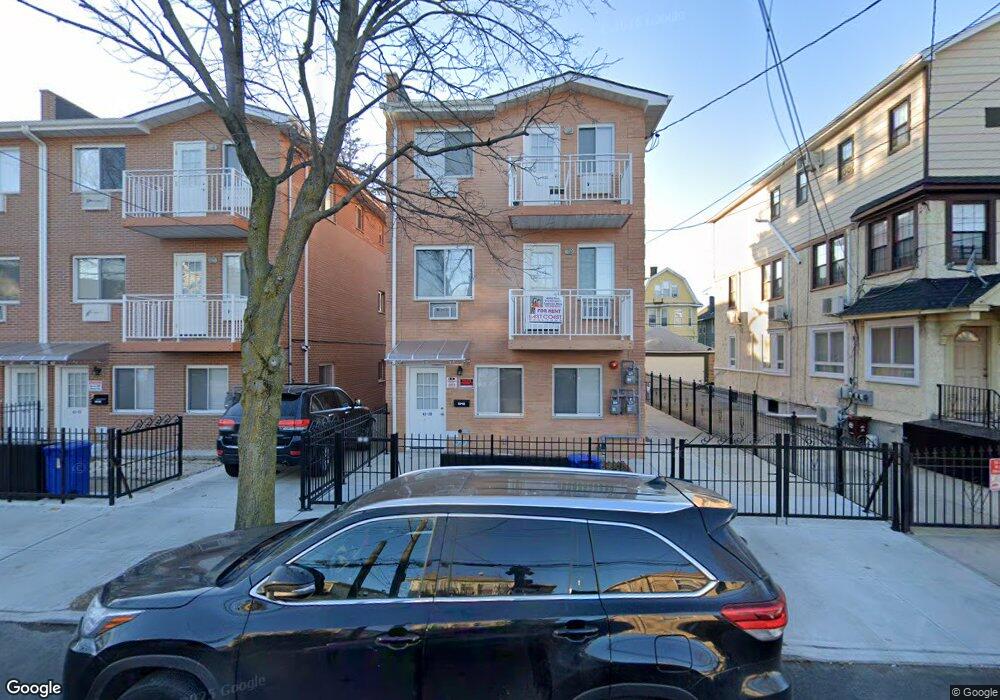
4332 160th St Flushing, NY 11358
East Flushing NeighborhoodEstimated Value: $1,851,846 - $2,306,000
Studio
--
Bath
3,150
Sq Ft
$652/Sq Ft
Est. Value
About This Home
This home is located at 4332 160th St, Flushing, NY 11358 and is currently estimated at $2,052,962, approximately $651 per square foot. 4332 160th St is a home located in Queens County with nearby schools including P.S. 107 Thomas A Dooley, I.S. 25 Adrien Block, and Francis Lewis High School.
Ownership History
Date
Name
Owned For
Owner Type
Purchase Details
Closed on
Dec 30, 2021
Sold by
19 Eldridge Realty Street Corporation
Bought by
Dong Yong Chun
Current Estimated Value
Purchase Details
Closed on
Oct 14, 2016
Sold by
H & V Management Ii Llc
Bought by
19 Eldridge Street Realty Corporation
Home Financials for this Owner
Home Financials are based on the most recent Mortgage that was taken out on this home.
Original Mortgage
$600,000
Interest Rate
3.44%
Mortgage Type
Purchase Money Mortgage
Purchase Details
Closed on
May 20, 2014
Sold by
Toong Swee Hee and Wang Su Y
Bought by
H & V Management Ii Llc
Purchase Details
Closed on
Dec 6, 2001
Sold by
Rumpitis Olgerts
Bought by
Wang Su Y and Toong Swee Hee
Home Financials for this Owner
Home Financials are based on the most recent Mortgage that was taken out on this home.
Original Mortgage
$277,000
Interest Rate
7.04%
Create a Home Valuation Report for This Property
The Home Valuation Report is an in-depth analysis detailing your home's value as well as a comparison with similar homes in the area
Home Values in the Area
Average Home Value in this Area
Purchase History
| Date | Buyer | Sale Price | Title Company |
|---|---|---|---|
| Dong Yong Chun | $1,730,000 | -- | |
| D & E 4330 Llc | -- | -- | |
| 19 Eldridge Street Realty Corporation | $1,812,485 | -- | |
| H & V Management Ii Llc | $950,000 | -- | |
| Wang Su Y | -- | -- |
Source: Public Records
Mortgage History
| Date | Status | Borrower | Loan Amount |
|---|---|---|---|
| Previous Owner | 19 Eldridge Street Realty Corporation | $600,000 | |
| Previous Owner | Wang Su Y | $277,000 |
Source: Public Records
Tax History
| Year | Tax Paid | Tax Assessment Tax Assessment Total Assessment is a certain percentage of the fair market value that is determined by local assessors to be the total taxable value of land and additions on the property. | Land | Improvement |
|---|---|---|---|---|
| 2025 | $15,365 | $71,880 | $25,383 | $46,497 |
| 2024 | $15,365 | $76,500 | $24,851 | $51,649 |
| 2023 | $16,010 | $79,712 | $19,796 | $59,916 |
| 2022 | $11,259 | $95,160 | $22,500 | $72,660 |
| 2021 | $15,826 | $89,940 | $22,500 | $67,440 |
| 2020 | $15,918 | $88,260 | $22,500 | $65,760 |
| 2019 | $15,260 | $86,340 | $22,500 | $63,840 |
| 2018 | $14,494 | $71,100 | $20,077 | $51,023 |
| 2017 | $5,925 | $29,067 | $15,057 | $14,010 |
| 2016 | $6,931 | $29,067 | $15,057 | $14,010 |
| 2015 | $3,725 | $34,006 | $34,006 | $0 |
| 2014 | $3,725 | $32,461 | $16,230 | $16,231 |
Source: Public Records
Map
Nearby Homes
- 4344 161st St
- 4363 160th St
- 4304 158th St Unit Lobby 4
- 4304 158th St Unit 2C
- 43-27 162nd St
- 42-28 159th St
- 43-58 163rd St
- 42-16 162nd St
- 43-23 156th St
- 43-33 163rd St
- 42-20 158th St
- 16003 Sanford Ave
- 16001 Sanford Ave
- 163-02 45th Ave
- 45-57 160th St
- 42-36 156th St
- 154-21 Ash Ave
- 15517 Sanford Ave Unit 2E
- 46-05 158th St
- 149-27 45th Ave
- 43-32 160th St Unit 3F
- 43-32 160th St Unit 2 Fl
- 4336 160th St
- 4330 160th St
- 4330 160th St
- 4330 160th St Unit 3 Fl
- 43-38 160th St
- 43-38 160 St Unit 2 Fl
- 43-36 160 St Unit 2FL
- 43-36 160 St
- 43-36 160th St
- 43-34 160th St
- 4338 160th St
- 43-32 160 St
- 4328 160th St Unit floor 1
- 4328 160th St
- 43-30 160st St
- 43-30 160th St
- 4340 160th St
- 4324 160th St
Your Personal Tour Guide
Ask me questions while you tour the home.