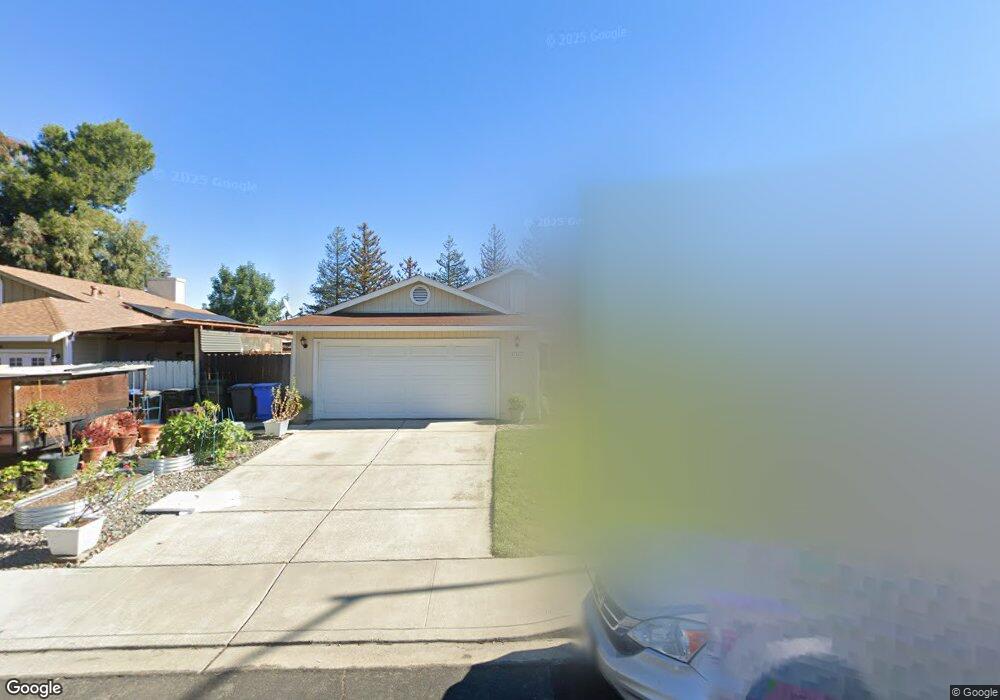
4332 Sequoia Dr Oakley, CA 94561
South Oakley NeighborhoodEstimated Value: $450,000 - $570,000
4
Beds
2
Baths
1,347
Sq Ft
$400/Sq Ft
Est. Value
About This Home
This home is located at 4332 Sequoia Dr, Oakley, CA 94561 and is currently estimated at $538,867, approximately $400 per square foot. 4332 Sequoia Dr is a home located in Contra Costa County with nearby schools including Laurel Elementary School, O'Hara Park Middle School, and Freedom High School.
Ownership History
Date
Name
Owned For
Owner Type
Purchase Details
Closed on
Oct 12, 2012
Sold by
Mcclure Keith Alan
Bought by
Mccoy Dane S
Current Estimated Value
Home Financials for this Owner
Home Financials are based on the most recent Mortgage that was taken out on this home.
Original Mortgage
$166,920
Outstanding Balance
$115,641
Interest Rate
3.52%
Mortgage Type
FHA
Estimated Equity
$423,226
Purchase Details
Closed on
Sep 22, 1999
Sold by
Federal Home Loan Mortgage Corporation
Bought by
Mcclure Keith Alan
Home Financials for this Owner
Home Financials are based on the most recent Mortgage that was taken out on this home.
Original Mortgage
$159,600
Interest Rate
7.97%
Mortgage Type
Purchase Money Mortgage
Purchase Details
Closed on
Jul 22, 1999
Sold by
Campbell William S and Campbell Sandra D
Bought by
Federal Home Loan Mortgage Corporation
Create a Home Valuation Report for This Property
The Home Valuation Report is an in-depth analysis detailing your home's value as well as a comparison with similar homes in the area
Home Values in the Area
Average Home Value in this Area
Purchase History
| Date | Buyer | Sale Price | Title Company |
|---|---|---|---|
| Mccoy Dane S | $170,000 | Fidelity National Title Co | |
| Mcclure Keith Alan | $168,000 | First American Title Guarant | |
| Federal Home Loan Mortgage Corporation | $168,000 | First American Title Co |
Source: Public Records
Mortgage History
| Date | Status | Borrower | Loan Amount |
|---|---|---|---|
| Open | Mccoy Dane S | $166,920 | |
| Previous Owner | Mcclure Keith Alan | $159,600 |
Source: Public Records
Tax History
| Year | Tax Paid | Tax Assessment Tax Assessment Total Assessment is a certain percentage of the fair market value that is determined by local assessors to be the total taxable value of land and additions on the property. | Land | Improvement |
|---|---|---|---|---|
| 2025 | $3,306 | $209,328 | $43,093 | $166,235 |
| 2024 | $3,216 | $205,225 | $42,249 | $162,976 |
| 2023 | $3,216 | $201,202 | $41,421 | $159,781 |
| 2022 | $3,194 | $197,258 | $40,609 | $156,649 |
| 2021 | $3,128 | $193,391 | $39,813 | $153,578 |
| 2019 | $2,886 | $187,657 | $38,633 | $149,024 |
| 2018 | $2,822 | $183,978 | $37,876 | $146,102 |
| 2017 | $2,799 | $180,372 | $37,134 | $143,238 |
| 2016 | $2,666 | $176,836 | $36,406 | $140,430 |
| 2015 | $2,679 | $174,181 | $35,860 | $138,321 |
| 2014 | $2,642 | $170,770 | $35,158 | $135,612 |
Source: Public Records
Map
Nearby Homes
- 912 Rhine Way
- 1425 W Cypress Rd
- 4834 Chablis Ct
- 151 Bedford Ln
- 2025 Truman Ln
- 0 Empire Ave Unit 41097524
- 0 Empire Ave Unit 41111855
- 4509 La Casa Ct
- 4920 Dawson Dr
- 4620 Duarte Ave
- 2019 Verona Ct
- 10 Kali Ct
- 0 Main St Unit 41115212
- 5025 Martin St
- 1 Bradford Island Rd
- 4901 Beldin Ln
- 1859 Santa fe St
- 5053 Miguel Dr
- 361 Clove Way
- 104 Genoa Way
- 4328 Sequoia Dr
- 4336 Sequoia Dr
- 4355 Mehaffey Way
- 4324 Sequoia Dr
- 4340 Sequoia Dr
- 260 Spindrift Ct
- 1669 Cedar Ct
- 4365 Mehaffey Way
- 4329 Sequoia Dr
- 4320 Sequoia Dr
- 4344 Sequoia Dr
- 270 Spindrift Ct
- 4323 Sequoia Dr
- 1681 Cedar Ct
- 4345 Mehaffey Way
- 4375 Mehaffey Way
- 250 Spindrift Ct
- 1672 Cedar Ct
- 4318 Sequoia Dr
- 4319 Sequoia Dr
Your Personal Tour Guide
Ask me questions while you tour the home.