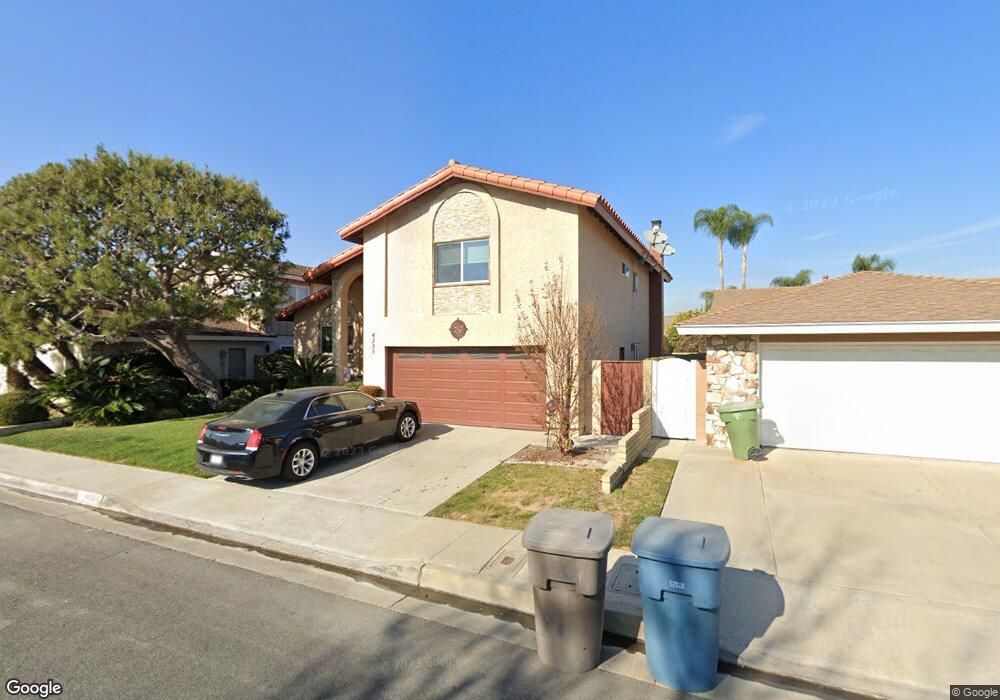
4333 Elder Ave Seal Beach, CA 90740
Estimated Value: $1,241,000 - $1,541,000
3
Beds
3
Baths
2,289
Sq Ft
$613/Sq Ft
Est. Value
About This Home
This home is located at 4333 Elder Ave, Seal Beach, CA 90740 and is currently estimated at $1,403,999, approximately $613 per square foot. 4333 Elder Ave is a home located in Orange County with nearby schools including Jack L. Weaver Elementary School, J. H. Mcgaugh Elementary School, and Sharon Christa Mcauliffe Middle School.
Ownership History
Date
Name
Owned For
Owner Type
Purchase Details
Closed on
Oct 1, 2024
Sold by
Pinto Family Trust and Pinto Philip P
Bought by
Guerra Erin Pinto
Current Estimated Value
Purchase Details
Closed on
Nov 11, 2017
Sold by
Pinto Santos Joseph
Bought by
Pinto Philip P and Pinto Family Trust
Purchase Details
Closed on
Oct 24, 2012
Sold by
Pinto Santo J and Pinto Ann E
Bought by
Pinto S Joseph and Pinto Ann E
Home Financials for this Owner
Home Financials are based on the most recent Mortgage that was taken out on this home.
Original Mortgage
$466,500
Interest Rate
3.28%
Mortgage Type
New Conventional
Purchase Details
Closed on
Oct 31, 2006
Sold by
Pinto Santo J and Pinto Ann E
Bought by
Pinto S Joseph and Pinto Ann E
Home Financials for this Owner
Home Financials are based on the most recent Mortgage that was taken out on this home.
Original Mortgage
$515,000
Interest Rate
6.36%
Mortgage Type
New Conventional
Create a Home Valuation Report for This Property
The Home Valuation Report is an in-depth analysis detailing your home's value as well as a comparison with similar homes in the area
Home Values in the Area
Average Home Value in this Area
Purchase History
| Date | Buyer | Sale Price | Title Company |
|---|---|---|---|
| Guerra Erin Pinto | -- | None Listed On Document | |
| Pinto Philip P | -- | None Available | |
| Pinto S Joseph | -- | Accommodation | |
| Pinto Santo J | -- | Lsi | |
| Pinto S Joseph | -- | None Available | |
| Pinto Santo J | -- | First American Title Company |
Source: Public Records
Mortgage History
| Date | Status | Borrower | Loan Amount |
|---|---|---|---|
| Previous Owner | Pinto Santo J | $466,500 | |
| Previous Owner | Pinto Santo J | $515,000 |
Source: Public Records
Tax History
| Year | Tax Paid | Tax Assessment Tax Assessment Total Assessment is a certain percentage of the fair market value that is determined by local assessors to be the total taxable value of land and additions on the property. | Land | Improvement |
|---|---|---|---|---|
| 2025 | $2,050 | $135,262 | $37,037 | $98,225 |
| 2024 | $2,050 | $132,610 | $36,311 | $96,299 |
| 2023 | $1,994 | $130,010 | $35,599 | $94,411 |
| 2022 | $1,968 | $127,461 | $34,901 | $92,560 |
| 2021 | $1,922 | $124,962 | $34,216 | $90,746 |
| 2020 | $1,914 | $123,681 | $33,865 | $89,816 |
| 2019 | $1,853 | $121,256 | $33,201 | $88,055 |
| 2018 | $1,784 | $118,879 | $32,550 | $86,329 |
| 2017 | $1,744 | $116,549 | $31,912 | $84,637 |
| 2016 | $1,707 | $114,264 | $31,286 | $82,978 |
| 2015 | $1,681 | $112,548 | $30,816 | $81,732 |
| 2014 | $1,624 | $110,344 | $30,213 | $80,131 |
Source: Public Records
Map
Nearby Homes
- 4424 Hazelnut Ave
- 3841 Heather St
- 4208 Birchwood Ave
- 4549 Birchwood Ave
- 4764 Fir Ave
- 3661 Wisteria St
- 3432 Yellowtail Dr
- 3252 Yellowtail Dr
- 11961 Bartlett St
- 12661 Saint Mark St
- 3162 Yellowtail Dr
- 11862 Paseo Bonita
- 12200 Montecito Rd Unit B315
- 12200 Montecito Rd Unit D303
- 12200 Montecito Rd Unit D102
- 12200 Montecito Rd Unit D101
- 12200 Montecito Rd Unit H207
- 12200 Montecito Rd Unit D301
- 3232 Brimhall Dr
- 12586 George Reyburn Rd
Your Personal Tour Guide
Ask me questions while you tour the home.